
Introduction
This article explains how to prepare a Line Chart in Android using Android Studio.
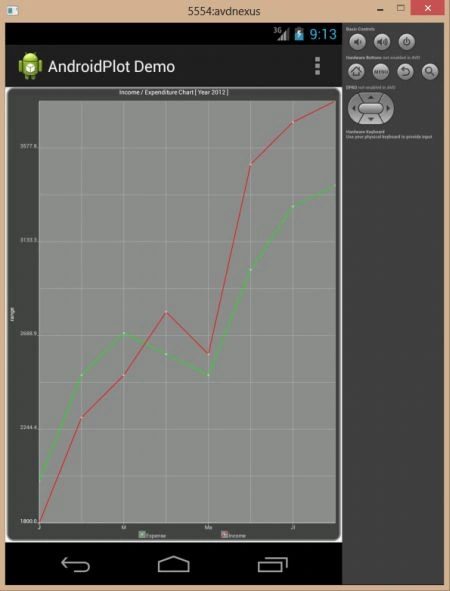
In this application, you will prepare a chart of income and expenses. You will see the graph showing the rise and fall of both income and expenses.
First, you will download the Android Plot Library. In your XML file you will create the Android plot and use the id of this in the Android XY plot variable. Then you will create three arrays, one of String type and another of number type with the values you want to show on the chart.
Second, you will get the object of XYplot returned by the SimpleXYSeries(). Now set the color for the line by the LineandPointFormatter class.
Step 1
Create an XML file and write this:
- <RelativeLayout xmlns:android="http://schemas.android.com/apk/res/android"
- xmlns:tools="http://schemas.android.com/tools"
- android:layout_width="match_parent"
- android:layout_height="match_parent"
- android:paddingLeft="@dimen/activity_horizontal_margin"
- android:paddingRight="@dimen/activity_horizontal_margin"
- android:paddingTop="@dimen/activity_vertical_margin"
- android:paddingBottom="@dimen/activity_vertical_margin"
- tools:context=".MainActivity">
- <com.androidplot.xy.XYPlot
- android:id="@+id/plotxy"
- android:layout_width="fill_parent"
- android:layout_height="fill_parent"
- title="Income / Expenditure Chart [ Year 2012 ]"/>
- </RelativeLayout>
Join the conversation! Your thoughts help the community grow.