

This article shows how to draw a Line or Multiple Line Charts using the MSChart control and also applying some important properties like Tool Tip, Legends, Line width, Shadow, 3D etc. A simple SQL Script which returns output for Category wise UnitPrice details which are plotted on a Chart Control. The sample code attached project was made using VS 2010 with the SQL Script. The project contains two web pages with samples of Single Line Chart and Multiple Line Charts. Prerequisite: VS 2008/2010, SQL Server.
References used
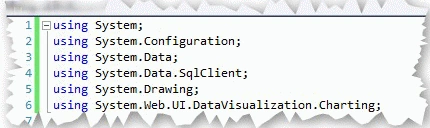

SingleLineChart.aspx.cs
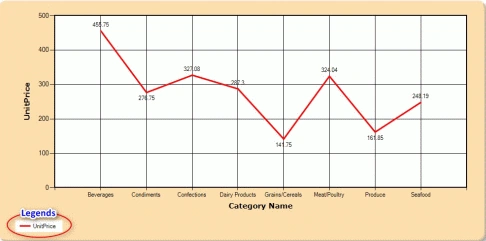
On Page Load an SQL Connection is made and using SqlDataReader data is get fetched from database.
If any rows are found, then the chart is plotted by creating a Chart Area, Series and plotting points for Series.
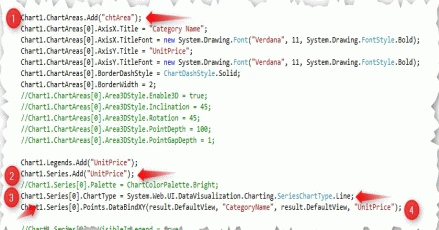
- Creating a ChartArea, it's the primary placeholder for plotting a chart.
- Creating a Series, used as a placeholder for the data points to get plotted on the chart.
- The Series Chart type must be a Line Chart.
- Points are plotted on a Series using the DataBindXY method by passing Column names and values to respective X and Y Axis of Chart, thus plotting the graph.
MultipleLineCharts.aspx.cs
Using two different SQL scripts and plotting two different Line Charts. For plotting multiple chart types we need to create multiple Series also on a single Chart Area.

The output will be as below.
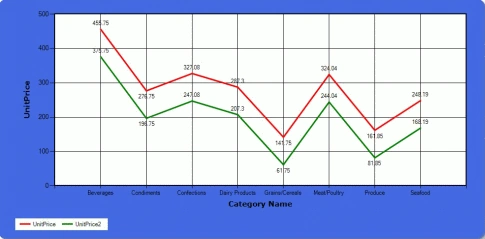
- Setting Chart border and BackColor.

- Setting Chart Area X and Y Axis values, enabling 3D etc.
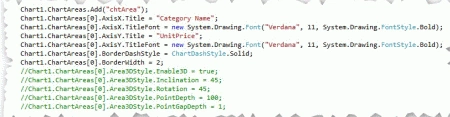
- Legend Properties

- Show Series data points as Label text, ToolTip, set border width and Line color.

Conclusion
This article shows how to draw a Line chart or Multiple Line Chart by using MSChart. Hope you all liked it; the sample code is attached for download and testing the code. Post your comments and rate the article. Post your queries to our Forum Section.
Javed AlamPosted Sep 13, 2018, 4:52 AM
Very nice..
Sandy SingPosted Jul 30, 2018, 12:11 AM
It is not showing all category name ? can you tell me how can i resolved it
krishantha de silvaPosted Mar 14, 2018, 11:52 PM
It is not work properly, it only draw two vertical line from edge of the chart pls help me to solve this problem
Akshaya arumugamPosted Feb 19, 2018, 7:56 AM
Oh great and nice I need to a comparison between 2 series take it data from SQL tables with c# windows form, can help me?
Sagar Pandurang KapPosted Dec 26, 2017, 4:13 AM
Nice tutorial.Well done..
Dinesh SanthalingamPosted Dec 20, 2016, 2:55 AM
Thanks for your article.great work.
Marwa MohammedPosted Dec 2, 2016, 1:29 PM
I need to comparison between 2 series take it data from sql tables with c# windows form,can help me?
Seethalakshmi BPosted Oct 10, 2015, 2:12 AM
Good one
SandyPosted Jun 18, 2014, 5:52 AM
great article
Dino GPosted Nov 12, 2013, 6:45 AM
Thanks 4 ur code
ali mohammadiPosted Nov 1, 2013, 5:32 PM
tanx your code was very helpfull for me
cenkPosted Jul 5, 2013, 7:59 AM
Thank you so much
avinash sahuPosted Mar 21, 2013, 10:55 AM
great
Suthish NairPosted Jan 8, 2013, 2:15 PM
:)
mathan kumarPosted Jan 7, 2013, 7:23 AM
sry. i was make some problem in my DB. Your code executed successful. thanx
mathan kumarPosted Jan 4, 2013, 6:16 AM
but some dll was missing
mathan kumarPosted Jan 4, 2013, 6:15 AM
thanx. it was very useful for me!
JOHN fooeditedPosted Dec 18, 2012, 9:13 AMEdited Dec 18, 2012, 9:14 AM
it cant run properly cos dun hav the database
kiran ghugeeditedPosted Dec 3, 2012, 7:12 AMEdited Dec 3, 2012, 7:22 AM
your article is most helpful but i have one query regarding chart i.e i have 10 column and i want to show all column on X axis but i can show only 9 column when i increasing 10th column odd number of column get disappear and only even number of column appear.sir can you please help me in this Thanks and regards Kiran Ghuge [email protected]
vivek meshramPosted Oct 15, 2012, 6:54 AM
helpful article ,what i want i got...thanks a lot sir..
fousia paPosted Apr 16, 2012, 12:00 AM
Useful article..Thanks
ramarao ullapaneniPosted Jan 21, 2012, 6:19 AM
nice post
Angelina ErinPosted Aug 1, 2011, 12:34 AM
Very Nice Article...........
Suthish NairPosted Jul 31, 2011, 5:07 PM
article re-written
Scott BrownPosted Sep 21, 2010, 4:37 PM
Suthish, The second post that you have there is exactly what i was looking for. Thank you very much for posting. Scott
Suthish NairPosted Sep 20, 2010, 10:18 AM
Hi Scott, There is no direct way in displaying the tables. refer article, shows legends plot.. http://www.c-sharpcorner.com/UploadFile/suthish_nair/3420/?ArticleID=88a98858-b5e3-477b-8a63-c168bb53681b Another way, is using a Grid View. Let me try, if got will share here..
Scott BrownPosted Sep 13, 2010, 1:02 PM
I need to show a data table at the bottom of my graph. Like the following: Jan Feb Mar Series 1 2.0 1.0 1.5 Series 2 3.0 2.1 2.1 Series 3 2.0 3.5 4.0 Any Ideas? I can get the table to show the Values on the right (Series 1, Series2, Series3). Thanks for the great article!