

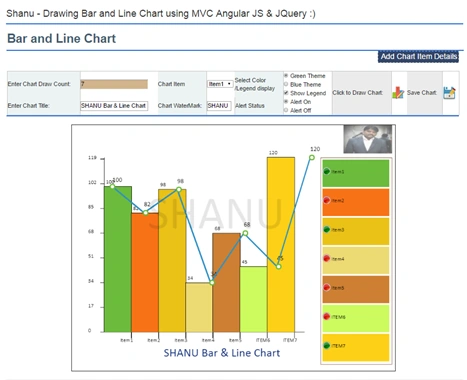
Introduction:
In our previous article we have seen in detail about how to draw Bar, Line and Pie Charts in MVC web Application. In this article we will see how to draw Bar and Line Chartsfor MVC applications using HTML5 Canvas, JQuery, WEB API and AngularJS.
In this series we will see one by one in detail starting from,
- MVC Dynamic Bar Chart using WEB API, AngularJS and JQuery
- MVC Dynamic Line Chart using WEB API, AngularJS and JQuery
- MVC Dynamic Pie Chart using WEB API, AngularJS and JQuery
- MVC Dynamic Line&Bar Chart using WEB API, AngularJS and JQuery
- MVC Dynamic Donut Chart using WEB API, AngularJS and JQuery
- MVC Dynamic Bubble Chart using WEB API, AngularJS and JQuery
Our Chart Features

- Chart Source Data:
Using WEB API and AngularJS we will be loading chart data from database to a Combobox. In our JQuery we will be plotting chart details from the Combobox.
- Chart Number of Category:
Chart Items will be dynamically loaded from database. Here we will plot all the Items in Combobox. It’s good to plot fewer than 12 Items per chart.
- Chart Title Text:
User can add their own Chart Title and dynamically change the titles if required. Here in our example we will draw the Title Textbox text at the Bottom of the Chart. (Users can redesign and customize as per requirements if needed).
- Chart Water Mark Text:
In some cases we need to add our Company name as Water Mark to our Chart. Here in our example we will draw the Water mark Textbox text at the center of the Chart. (User can redesign and customize as per your requirements if needed).
- Chart Company LOGO:
User can add their own Company logo to the Chart.(Here for sample we have added my own image as a Logo at the Top left corner.( User can redesign and customize as per your requirements if needed.).
- Chart Alert Image Display:
If the “Alert On” radio button is checked we will display the Alert Image. If the “Alert Off” radio button is clicked then the Alert Image will not be displayed. In JQuery we have declared alertCheckValue = 90; and we check the plot data with this aleartcheckValue and if the plot value is greater than this check value then we will display the alert image in the legend.
What is the use of Alert Image?
Let’s consider a real time project. For example we need to display the chart for a Manufacturing factory with production result as Good and Bad. For example if production result for each quality value is above 90 we need to display the Alert green Image and if the quality value is below 90 then we need to display the Red Image with label bars.
This Alert Image will be easy to identify each quality result with good or bad. (Here for a sample we have used for quality check and display green and red images, but users can customize as per your requirement and add your own image and logics.).
- Save Chart as Image: user can save the chart as Image.
- Chart Theme :
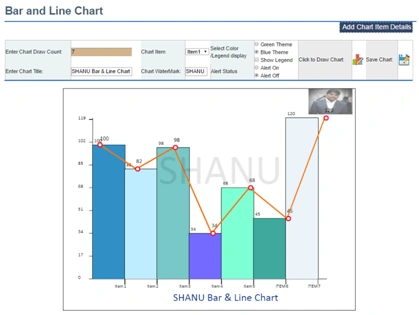
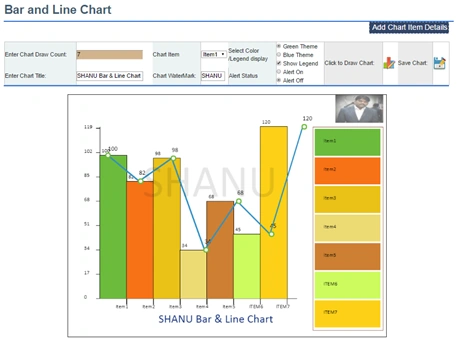
Here we have created two themes, Blue and Green, for our Chart. We can see both theme outputs here. User can also add any numbers of themes as they require.
Blue Theme
Green Theme
In this Article we have 2 parts,
- Chart Item and Value Insert/Update to database, Select Chart Item and Value to Combobox from database using WEB API, AngularJS.
- Using JQuery Draw our own Chart to HTML5 Canvas tag in our MVC page.
Prerequisites
Visual Studio 2015: You can download it from here.
Code Part
In Code part we can see three Steps,
Step 1:
Explains about how to create a sample Database, Table, Stored procedure to select, Insert and Update Chart data to SQL Server.
Step 2:
Explains about how to create a WEB API to get the data and bind the result to MVC page using AngularJS.
Step 3: Explains about how to draw our own Chart to our MVC Web application using JQuery.
Step 1: Script to create Table and Stored Procedure
We will create aItemMaster table under the Database ‘ItemsDB. The following is the script to create a database, table and sample insert query. Run this script in your SQL Server. I have used SQL Server 2014.
- USEMASTER
- GO
- -- 1) Check for the Database Exists .If the database is exist then drop and create new DB
- IFEXISTS(SELECT [name] FROMsys.databasesWHERE [name] ='ItemsDB')
- DROPDATABASEItemsDB
- GO
- CREATEDATABASEItemsDB
- GO
- USEItemsDB
- GO
- -- 1) //////////// Item Masters
- IFEXISTS(SELECT [name] FROMsys.tablesWHERE [name] ='ItemMaster')
- DROPTABLEItemMaster
- GO
- CREATETABLE [dbo].[ItemMaster](
- [ItemID] INTIDENTITYPRIMARYKEY,
- [ItemName] [varchar](100)NOTNULL,
- [SaleCount] [varchar](10)NOTNULL
- )
- -- insert sample data to Item Master table
- INSERTINTOItemMaster([ItemName],[SaleCount])
- VALUES ('Item1','100')
- INSERTINTOItemMaster([ItemName],[SaleCount])
- VALUES ('Item2','82')
- INSERTINTOItemMaster([ItemName],[SaleCount])
- VALUES ('Item3','98')
- INSERTINTOItemMaster([ItemName],[SaleCount])
- VALUES ('Item4','34')
- INSERTINTOItemMaster([ItemName],[SaleCount])
- VALUES ('Item5','68')
- select*fromItemMaster
- -- 1)To Select Item Details
- -- Author : Shanu
- -- Create date : 2016-03-15
- -- Description :To Select Item Details
- -- Tables used :ItemMaster
- -- Modifier : Shanu
- -- Modify date : 2016-03-15
- -- =============================================
- -- To Select Item Details
- -- EXEC USP_Item_Select ''
- -- =============================================
- CREATEPROCEDURE [dbo].[USP_Item_Select]
- (
- @ItemName VARCHAR(100)=''
- )
- AS
- BEGIN
- SELECTItemName,
- SaleCount
- FROMItemMaster
- WHERE
- ItemNamelike @ItemName+'%'
- OrderBYItemName
- END
- GO
- -- 2) To Insert/Update Item Details
- -- Author : Shanu
- -- Create date : 2016-03-15
- -- Description :To Insert/Update Item Details
- -- Tables used :ItemMaster
- -- Modifier : Shanu
- -- Modify date : 2016-03-15
- -- =============================================
- -- To Insert/Update Item Details
- -- EXEC USP_Item_Edit ''
- -- =============================================
- CREATEPROCEDURE [dbo].[USP_Item_Edit]
- (
- @ItemName VARCHAR(100)='',
- @SaleCount VARCHAR(10)=''
- )
- AS
- BEGIN
- IFNOTEXISTS(SELECT*FROMItemMasterWHEREItemName=@ItemName)
- BEGIN
- INSERTINTOItemMaster([ItemName],[SaleCount])
- VALUES (@ItemName,@SaleCount)
- Select'Inserted'as results
- return;
- END
- ELSE
- BEGIN
- UpdateItemMasterSET
- SaleCount=@SaleCount
- WHEREItemName=@ItemName
- Select'Updated'as results
- return;
- END
- Select'Error'as results
- END
- -- 3)To Max and Min Value
- -- Author : Shanu
- -- Create date : 2016-03-15
- -- Description :To Max and Min Value
- -- Tables used :ItemMaster
- -- Modifier : Shanu
- -- Modify date : 2016-03-15
- -- =============================================
- -- To Max and Min Value
- -- EXEC USP_ItemMaxMin_Select ''
- -- =============================================
- CREATEPROCEDURE [dbo].[USP_ItemMaxMin_Select]
- (
- @ItemName VARCHAR(100)=''
- )
- AS
- BEGIN
- SELECTMIN(convert(int,SaleCount))asMinValue,
- MAX(convert(int,SaleCount))asMaxValue
- FROMItemMaster
- WHERE
- ItemNamelike @ItemName+'%'
- END
- GO
After installing our Visual Studio 2015 click Start, then Programs and select Visual Studio 2015 - Click Visual Studio 2015. Click New, then Project, select Web and then select ASP.NET Web Application. Enter your project name and click OK.
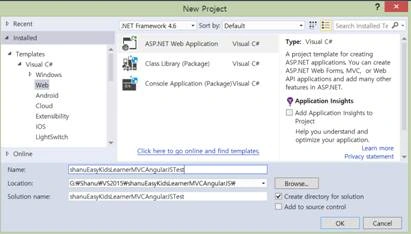
Select MVC, WEB API and click OK.
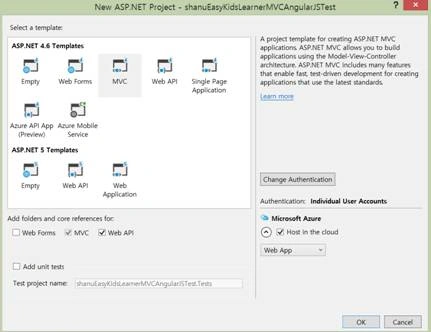
Now we have created our MVC Application as a next step we add our SQL server database as Entity Data Model to our application.
Add Database using ADO.NET Entity Data Model
Right click our project and click Add -> New Item.
Select Data->Select ADO.NET Entity Data Model> Give the name for our EF and click Add,
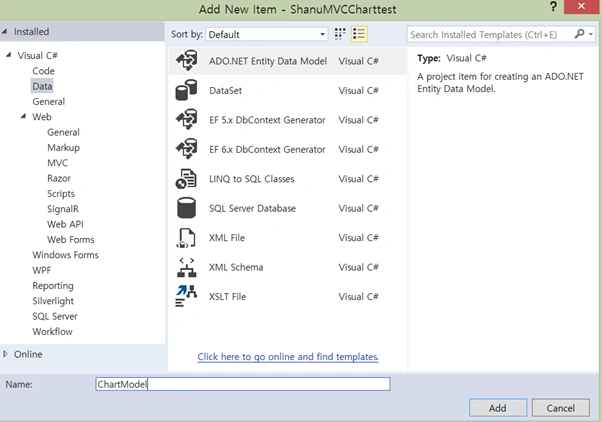
Select EF Designer from database and click next.
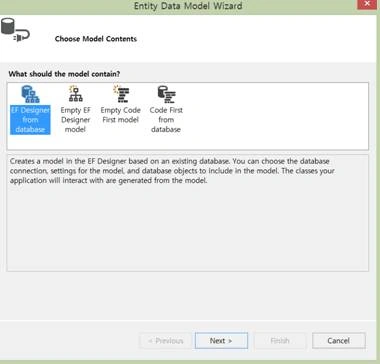
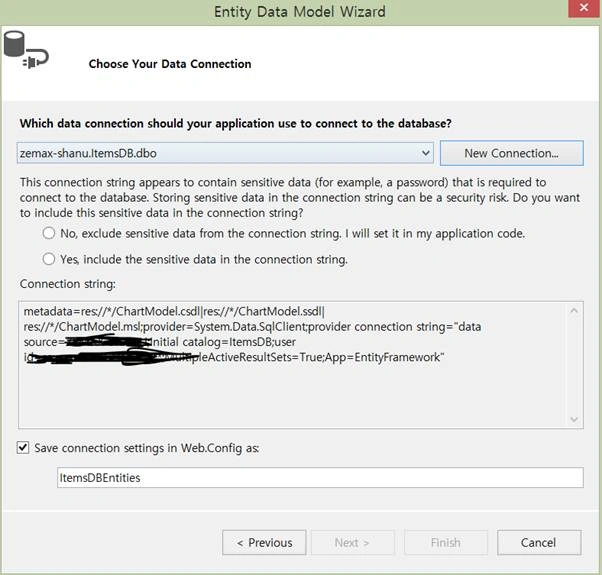
Here click New Connection and provide your SQL-Server Server Name and connect to your database.
Here we can see we have given our SQL server name, Id and PWD and after it connects we have selected the data base as ItemsDB as we have created the Database using my SQL Script.
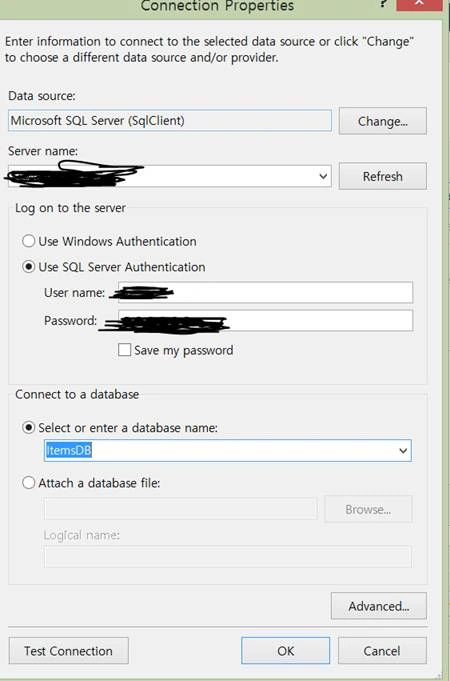
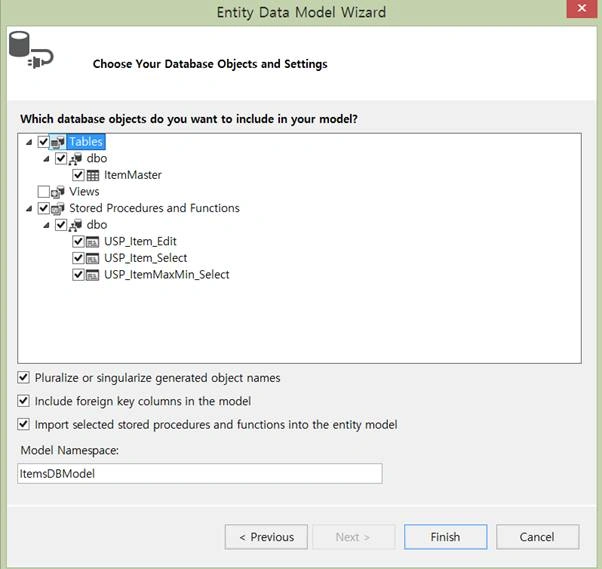
Click next and select our tables that need to be used and click finish.
Here we can see we have selected our table ItemMasters and all needed Stored Procedures; after selecting click Finish
Once Entity has been created the next stepis we add WEB API to our controller and write function to select/Insert/Update and Delete.
Steps to add our WEB API Controller
Right Click Controllers folder-> Click Add-> Click Controller.
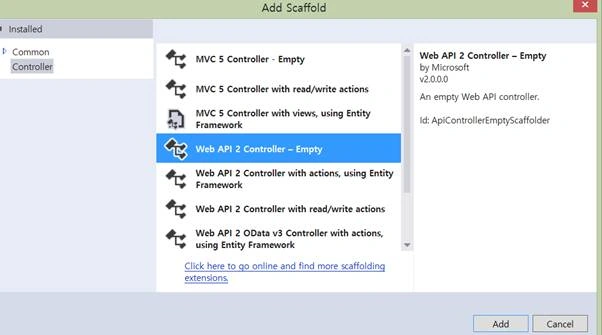
As we are going to create our WEB API Controller.Select Controller and Add Empty WEB API 2 Controller. Give your Name to Web API controller and click ok. Here for my Web API Controller I have given name as “StudentsController”.
As we all know Web API is a simple and easy to build HTTP Services for Browsers and Mobiles.
- Get is to request for the data. (Select).
- Post is to create a data. (Insert).
- Putis to update the data.
- Delete is to delete data.
Get Method
In our example I have used only Get method as I am using only Stored Procedure. We need to create object for our Entity and write our Get Method to perform Select/Insert/Update and Delete operations.
Select Operation
We use get Method to get all the details of itemMaster table using entity object and we return the result as IEnumerable .We use this method in our AngularJS and bind the result in ComboBox and insert the new chart Item to Database using the Insert Method.
- publicclassItemAPIController: ApiController
- {
- ItemsDBEntitiesobjapi = newItemsDBEntities();
- // To get all Item chart detaiuls
- [HttpGet]
- publicIEnumerable < USP_Item_Select_Result > getItemDetails(stringItemName)
- {
- if (ItemName == null)
- ItemName = "";
- returnobjapi.USP_Item_Select(ItemName).AsEnumerable();
- }
- // To get maximum and Minimum value
- [HttpGet]
- publicIEnumerable < USP_ItemMaxMin_Select_Result > getItemMaxMinDetails(stringItemNM)
- {
- if (ItemNM == null)
- ItemNM = "";
- returnobjapi.USP_ItemMaxMin_Select(ItemNM).AsEnumerable();
- }
- // To Insert/Update Item Details
- [HttpGet]
- publicIEnumerable < string > insertItem(stringitemName, stringSaleCount)
- {
- returnobjapi.USP_Item_Edit(itemName, SaleCount).AsEnumerable();
- }
- }
Creating AngularJS Controller
First create a folder inside the Script Folder and we give the folder name as “MyAngular”.
Now add your Angular Controller inside the folder.
Right Click the MyAngular Folder and click Add and New Item > Select Web > Select AngularJs Controller and give name to Controller.We have given my AngularJs Controller as “Controller.js”
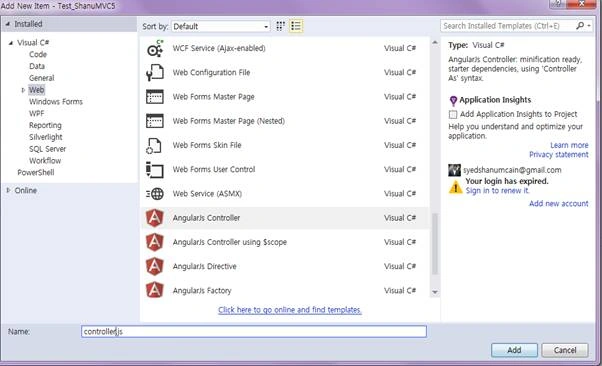
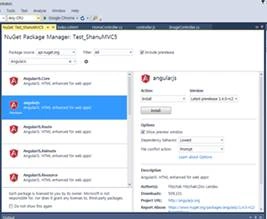
If the Angular JS package is missing then add the package to your project.
Right Click your MVC project and Click-> Manage NuGet Packages. Search for AngularJs and click Install.
Modules.js: Here we will add the reference to the AngularJS JavaScript and create an Angular Module named,
- “AngularJs_Module”.
- // <reference path="../angular.js" />
- /// <reference path="../angular.min.js" />
- /// <reference path="../angular-animate.js" />
- /// <reference path="../angular-animate.min.js" />
- var app;
- (function()
- {
- app = angular.module("AngularJs_Module", ['ngAnimate']);
- })();
Controllers: In AngularJS Controller I have done all the business logic and returned the data from Web API to our MVC HTML page.
- Variable declarations
Firstly, we declared all the local variables need to be used.
- app.controller("AngularJs_Controller", function($scope, $timeout, $rootScope, $window, $http, FileUploadService)
- {
- $scope.date = newDate();
- // <reference path="../angular.js" />
- /// <reference path="../angular.min.js" />
- /// <reference path="../angular-animate.js" />
- /// <reference path="../angular-animate.min.js" />
- var app;
- (function()
- {
- app = angular.module("RESTClientModule", ['ngAnimate']);
- })();
- app.controller("AngularJs_Controller", function($scope, $timeout, $rootScope, $window, $http)
- {
- $scope.date = newDate();
- $scope.MyName = "shanu";
- $scope.sItemName = "";
- $scope.itemCount = 5;
- $scope.selectedItem = "";
- $scope.chartTitle = "SHANU Pie Chart";
- $scope.waterMark = "SHANU";
- $scope.ItemValues = 0;
- $scope.ItemNames = "";
- $scope.showItemAdd = false;
- $scope.minsnew = 0;
- $scope.maxnew = 0;
- }
- Methods
Select Method

Here we get all the data from WEB API and bind the result to our ComboBox and we have used another method to get the maximum and Minimum Value of Chart Value and bind in hidden field.
Insert Method- // This method is to get all the Item Details to bind in Combobox for plotting in Graph
- selectuerRoleDetails($scope.sItemName);
- // This method is to get all the Item Details to bind in Combobox for plotting in Graph
- functionselectuerRoleDetails(ItemName)
- {
- $http.get('/api/ItemAPI/getItemDetails/',
- {
- params:
- {
- ItemName: ItemName
- }
- }).success(function(data)
- {
- $scope.itemData = data;
- $scope.itemCount = $scope.itemData.length;
- $scope.selectedItem = $scope.itemData[0].SaleCount;
- })
- .error(function()
- {
- $scope.error = "An Error has occured while loading posts!";
- });
- $http.get('/api/ItemAPI/getItemMaxMinDetails/',
- {
- params:
- {
- ItemNM: $scope.sItemName
- }
- }).success(function(data)
- {
- $scope.itemDataMaxMin = data;
- $scope.minsnew = $scope.itemDataMaxMin[0].MinValue;
- $scope.maxnew = $scope.itemDataMaxMin[0].MaxValue;
- })
- .error(function()
- {
- $scope.error = "An Error has occured while loading posts!";
- });
- }
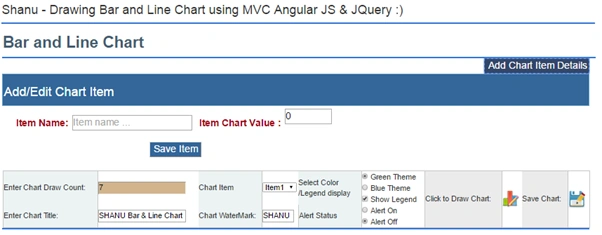
User can Insert or update Chart Item value by clicking Add Chart Item Details. After validation we pass the Chart Item name and Value to WEB API method to insert in to our database.
- //Save File
- $scope.saveDetails = function()
- {
- $scope.IsFormSubmitted = true;
- $scope.Message = "";
- if ($scope.ItemNames == "")
- {
- alert("Enter Item Name");
- return;
- }
- if ($scope.ItemValues == "")
- {
- alert("Enter Item Value");
- return;
- }
- if ($scope.IsFormValid)
- {
- alert($scope.ItemNames);
- $http.get('/api/ItemAPI/insertItem/',
- {
- params:
- {
- itemName: $scope.ItemNames,
- SaleCount: $scope.ItemValues
- }
- }).success(function(data)
- {
- $scope.CharDataInserted = data;
- alert($scope.CharDataInserted);
- cleardetails();
- selectuerRoleDetails($scope.sItemName);
- })
- .error(function()
- {
- $scope.error = "An Error has occured while loading posts!";
- });
- } else
- {
- $scope.Message = "All the fields are required.";
- }
- };
- });
Step 3 : Todraw our Chart using JQuery to our MVC page Canvas Tag
Here we will see in detail about how to draw our Pie Chart on our MVC Web Application using JQuery.
Inside the java Script declare the global variables and initialize the Canvas in JavaScript. In the code we have used comments to easily understand the declarations.
Script Detail Explanations
Script Global variable
Chart Category Color Add
Adding the Chart category colors to array .Here we have fixed to 12 colors and 12 datas to add with Pie Chart. If you want you can add more from here. Here we have 2 sets of color combinations, one with Green base and one with a Blue base. User can add as per your requirement here.
- varpirChartColor = ["#6CBB3C", "#F87217", "#EAC117", "#EDDA74", "#CD7F32", "#CCFB5D", "#FDD017", "#9DC209", "#E67451", "#728C00", "#617C58", "#64E986"]; // green Color Combinations
- // varpirChartColor = ["#3090C7", "#BDEDFF", "#78C7C7", "#736AFF", "#7FFFD4", "#3EA99F", "#EBF4FA", "#F9B7FF", "#8BB381", "#BDEDFF", "#B048B5", "#4E387E"]; // Blue Color Combinations
- //This method will be used to check for user selected Color Theme and Change the color
- functionChangeChartColor()
- {
- if ($('#rdoColorGreen:checked').val() == "Green Theme")
- {
- pirChartColor = ["#6CBB3C", "#F87217", "#EAC117", "#EDDA74", "#CD7F32", "#CCFB5D", "#FDD017", "#9DC209", "#E67451", "#728C00", "#617C58", "#64E986"]; // green Color Combinations
- lineColor = "#3090C7"; // Blue Color for Line
- lineOuterCircleColor = "#6CBB3C"; // Green Color for Outer Circle
- } else
- {
- pirChartColor = ["#3090C7", "#BDEDFF", "#78C7C7", "#736AFF", "#7FFFD4", "#3EA99F", "#EBF4FA", "#F9B7FF", "#8BB381", "#BDEDFF", "#B048B5", "#4E387E"]; // Blue Color Combinations
- lineColor = "#F87217"; // Orange Color for the Line
- lineOuterCircleColor = "#F70D1A "; // Red Color for the outer circle
- }
- }
- // to return the x-Value
- functiongetXPlotvalue(val)
- {
- return (Math.round((chartWidth) / noOfPlots)) * val + (xSpace * 1.5) - 20;
- }
- // Return the y value
- functiongetYPlotVale(val)
- {
- returnchartHeight - (((chartHeight - xSpace) / maxDataVal) * val);
- }
- // This function is used to draw the Legend
- functiondrawLengends()
- {
- ctx.fillStyle = "#7F462C";
- ctx.fillRect(rect.startX, rect.startY, rect.w, rect.h);
- //Drawing Inner White color Rectange with in Above brown rectangle to plot all the Lables with color,Text and Value.
- ctx.fillStyle = "#FFFFFF";
- rectInner.startX = rect.startX + 1;
- rectInner.startY = rect.startY + 1;
- rectInner.w = rect.w - 2;
- rectInner.h = rect.h - 2;
- ctx.fillRect(rectInner.startX, rectInner.startY, rectInner.w, rectInner.h);
- labelBarX = rectInner.startX + 4;
- labelBarY = rectInner.startY + 4;
- labelBarWidth = rectInner.w - 10;
- labelBarHeight = (rectInner.h / noOfPlots) - 5;
- colorval = 0;
- // here to draw all the rectangle for Lables with Image display
- $('#DropDownList1 option').each(function()
- {
- ctx.fillStyle = pirChartColor[colorval];
- ctx.fillRect(labelBarX, labelBarY, labelBarWidth, labelBarHeight);
- // Here we check for the rdoAlert Status is On - If the Alert is on then we display the Alert Image as per the Alert check value.
- if ($('#rdoAlaramOn:checked').val() == "Alert On")
- {
- // Here we can see fo ever chart value we check with the condition .we have initially declare the alertCheckValue as 300.
- //so if the Chart Plot value is Greater then or equal to the check value then we display the Green Image else we display the Red Image.
- //user can change this to your requiremnt if needed.This is optioan function for the Pie Chart.
- if (parseInt($(this).val()) >= alertCheckValue)
- {
- ctx.drawImage(greenImage, labelBarX, labelBarY + (labelBarHeight / 3) - 4, imagesize, imagesize);
- } else {
- ctx.drawImage(redImage, labelBarX, labelBarY + (labelBarHeight / 3) - 4, imagesize, imagesize);
- }
- }
- //Draw the Pie Chart Label text and Value
- ctx.fillStyle = "#000000";
- ctx.font = '10pt Calibri';
- ctx.fillText($(this).text(), labelBarX + imagesize + 2, labelBarY + (labelBarHeight / 2));
- // To Increment and draw the next bar ,label Text and Alart Image.
- labelBarY = labelBarY + labelBarHeight + 4;
- // labelTextYXVal = labelBarY + labelBarHeight - 4;
- colorval = colorval + 1;
- });
- }
This is our main Function .Here we get all the details to draw our Bar and Line Chart. In this function we will draw Chart Title, Chart Water Mark text, Chart Logo Image and finally call draw Bar and Line chart Method to draw our combination of Bar & Line chart inside Canvas Tag.
- // This is the main function to darw the Charts
- functiondrawChart() {
- ChangeChartColor();
- // asign the images path for both Alert images
- greenImage.src = '../images/Green.png';
- redImage.src = '../images/Red.png';
- LogoImage.src = '../images/shanu.jpg';
- // Get the minumum and maximum value.herei have used the hidden filed from code behind wich will stored the Maximum and Minimum value of the Drop down list box.
- minDataVal = $('input:text[name=hidListMin]').val();
- maxDataVal = $('input:text[name=hidListMax]').val();
- // Total no of plots we are going to draw.
- noOfPlots = $("#DropDownList1 option").length;
- maxValdivValue = Math.round((maxDataVal / noOfPlots));
- //storing the Canvas Context to local variable ctx.This variable will be used to draw the Pie Chart
- canvas = document.getElementById("canvas");
- ctx = canvas.getContext("2d");
- //globalAlpha - > is used to display the 100% opoacity of chart .because at the bottom of the code I have used the opacity to 0.1 to display the water mark text with fade effect.
- ctx.globalAlpha = 1;
- ctx.fillStyle = "#000000";
- ctx.strokeStyle = '#000000';
- //Every time we clear the canvas and draw the chart
- ctx.clearRect(0, 0, canvas.width, canvas.height);
- //If need to draw with out legend for the Line Chart
- chartWidth = canvas.width - xSpace;
- chartHeight = canvas.height - ySpace;
- // step 1) Draw legend $$$$$$$$$$$$$$$$$$$$$$$$$$$$$$$$$$$$$$$$$########################
- if ($('#chkLegend:checked').val() == "Show Legend") {
- chartWidth = canvas.width - ((canvas.width / 3) - (xSpace / 2));
- chartHeight = canvas.height - ySpace - 10;
- legendWidth = canvas.width - ((canvas.width / 3) - xSpace);
- legendHeight = ySpace;
- rect.startX = legendWidth;
- rect.startY = legendHeight;
- rect.w = canvas.width / 3 - xSpace - 10;
- rect.h = canvas.height - ySpace - 10;
- //In this method i will draw the legend with the Alert Image.
- drawLengends();
- }
- // end step 1) $$$$$$$$$$$$$$$$$$$$$$$$$$$$$$$$$$$
- varchartMidPosition = chartWidth / 2 - 60;
- //// //If need to draw with legend
- //// chartWidth = canvas.width - ((canvas.width / 3) - (xSpace / 2));
- //// chartHeight = canvas.height - ySpace - 10;
- // Step 2 ) +++++++++++++ To Add Chart Titel and Company Logo
- //To Add Logo to Chart
- varlogoXVal = canvas.width - LogoImgWidth - 10;
- varlogolYVal = 0;
- //here we draw the Logo for teh chart and i have used the alpha to fade and display the Logo.
- ctx.globalAlpha = 0.6;
- ctx.drawImage(LogoImage, logoXVal, logolYVal, LogoImgWidth, LogoImgHeight);
- ctx.globalAlpha = 1;
- ctx.font = '22pt Calibri';
- ctx.fillStyle = "#15317E";
- vartitletxt = $('input:text[name=txtTitle]').val();
- ctx.fillText(titletxt, chartMidPosition, chartHeight + 60);
- ctx.fillStyle = "#000000";
- ctx.font = '10pt Calibri';
- // end step 2) +++++++++++ End of Title and Company Logo Add
- // Step 3 ) +++++++++++++ toDraw the X-Axis and Y-Axis
- // >>>>>>>>> Draw Y-Axis and X-Axis Line(Horizontal Line)
- // Draw the axises
- ctx.beginPath();
- ctx.moveTo(xSpace, ySpace);
- // first Draw Y Axis
- ctx.lineTo(xSpace, chartHeight);
- // Next draw the X-Axis
- ctx.lineTo(chartWidth, chartHeight);
- ctx.stroke();
- // >>>>>>>>>>>>> End of X-Axis Line Draw
- //end step 3) +++++++++++++++++++++++
- // Step 4) <<<<<<<<<<<<<<<<<<<<<<< To Draw X - Axis Plot Values <<<<<<<<<<<<< }}}}}}
- // Draw the X value texts
- // --->>>>>>>>>>>> for the Bar Chart i have draw the X-Axis plot in with drawBarChart
- // <<<<<<<<<<<<<<<<<<<<<<< End of X Axis Draw
- // end Step 4) <<<<<<<<<<<<<<<<<<<<<<<
- // Step 5){{{{{{{{{{{{
- // {{{{{{{{{{{{{To Draw the Y Axis Plot Values}}}}}}}}}}}}}}
- varvAxisPoints = 0;
- var max = maxDataVal;
- max += 10 - max % 10;
- for (vari = 0; i <= maxDataVal; i += maxValdivValue) {
- ctx.fillStyle = fotnColor;
- ctx.font = axisfontSize + 'pt Calibri';
- ctx.fillText(i, xSpace - 40, getYPlotVale(i));
- //Here we draw the Y-Axis point line
- ctx.beginPath();
- ctx.moveTo(xSpace, getYPlotVale(i));
- ctx.lineTo(xSpace - 10, getYPlotVale(i));
- ctx.stroke();
- vAxisPoints = vAxisPoints + maxValdivValue;
- }
- //}}}}}}}}}}}}}}}}}}}}}}}}}}}}}}}}}}}}}}
- //Step 5) *********************************************************
- //Function to Draw our Chart here we can Call/Bar Chart/Line Chart or Pie Chart
- // to Draw Bar Chart
- drawBarChart();
- // to Draw line Chart
- drawLineChart();
- // end step 6) **************
- //Step 7) :::::::::::::::::::: to add the Water mark Text
- varwaterMarktxt = $('input:text[name=txtWatermark]').val();
- // Here add the Water mark text at center of the chart
- ctx.globalAlpha = 0.1;
- ctx.font = '86pt Calibri';
- ctx.fillStyle = "#000000";
- ctx.fillText(waterMarktxt, chartMidPosition - 40, chartHeight / 2);
- ctx.font = '10pt Calibri';
- ctx.globalAlpha = 1;
- /// end step 7) ::::::::::::::::::::::::::::::::::::::
- }
- functiondrawBarChart()
- {
- varXvalPosition = xSpace;
- widthcalculation = parseInt(((parseInt(chartWidth) - 100) / noOfPlots));
- colorval = 0;
- varcountval = 0;
- $('#DropDownList1').val($('#DropDownList1 option').eq(0).val());
- $('#DropDownList1 option').each(function(i)
- {
- // alert($(this).text() + " : " + $(this).val());
- // Draw Xaxis Plots Line and Text ***********
- XvalPosition = XvalPosition + widthcalculation;
- ctx.moveTo(XvalPosition, chartHeight);
- ctx.lineTo(XvalPosition, chartHeight + 15);
- ctx.stroke();
- ctx.fillStyle = "#000000";
- ctx.font = '10pt Calibri';
- ctx.fillText($(this).text(), XvalPosition - 28, chartHeight + 24);
- // EndXval Plotting ************
- //Draw Bar Graph **************==================********************
- varbarRatio = parseInt($(this).val()) / maxDataVal;
- //alert(ratio)
- varbarfillHeight = parseInt(barRatio * (parseInt(chartHeight - xSpace)));
- // alert(barHeight)
- ctx.fillRect(XvalPosition - widthcalculation - 1, chartHeight - 1, widthcalculation + 2, -barfillHeight);
- ctx.fillStyle = pirChartColor[colorval];
- // e.DrawRectangle(B1pen, XvalPosition_Start, Ystartval, XvalPosition_new, YEndval);
- ctx.fillRect(XvalPosition - widthcalculation, chartHeight, widthcalculation, -barfillHeight);
- //ctx.fillRect(XvalPosition - widthcalculation, yLineHeight, widthcalculation, yLineHeight- parseInt($(this).val()));
- // *****
- ctx.fillStyle = "#000000";
- ctx.font = '10pt Calibri';
- ctx.fillText($(this).val(), XvalPosition - widthcalculation + 4, chartHeight - barfillHeight - 8);
- ctx.fillStyle = pirChartColor[colorval];
- //END Draw Bar Graph **************==================********************
- colorval = colorval + 1;
- });
- }
- functiondrawLineChart() {
- // For Drawing Line
- ctx.lineWidth = 3;
- var value = $('select#DropDownList1 option:selected').val();
- ctx.beginPath();
- // *************** To Draw the Line and Plot Value in Line
- ctx.fillStyle = "#FFFFFF";
- ctx.strokeStyle = '#FFFFFF';
- ctx.moveTo(getXPlotvalue(0), getYPlotVale(value));
- ctx.fillStyle = "#000000";
- ctx.font = '12pt Calibri';
- ctx.fillText(value, getXPlotvalue(0), getYPlotVale(value) - 12);
- varival = 0;
- $('#DropDownList1').val($('#DropDownList1 option').eq(0).val());
- $('#DropDownList1 option').each(function(i) {
- if (ival > 0) {
- ctx.lineTo(getXPlotvalue(ival) - 4, getYPlotVale($(this).val()));
- ctx.stroke();
- ctx.fillStyle = "#000000";
- ctx.font = '12pt Calibri';
- ctx.fillText($(this).val(), getXPlotvalue(ival) - 4, getYPlotVale($(this).val()) - 16);
- }
- ival = ival + 1;
- ctx.fillStyle = lineColor;
- ctx.strokeStyle = lineColor;
- });
- // *************** To Draw the Line Dot Cericle
- //For Outer Blue Dot
- ival = 0;
- $('#DropDownList1 option').each(function(i)
- {
- ctx.fillStyle = lineOuterCircleColor;
- ctx.strokeStyle = lineOuterCircleColor;
- ctx.beginPath();
- ctx.arc(getXPlotvalue(ival), getYPlotVale($(this).val()), 7, 0, Math.PI * 2, true);
- ctx.fill();
- ctx.fillStyle = lineInnerCircleColor;
- ctx.strokeStyle = lineInnerCircleColor;
- ctx.beginPath();
- ctx.arc(getXPlotvalue(ival), getYPlotVale($(this).val()), 4, 0, Math.PI * 2, true);
- ctx.fill();
- ival = ival + 1;
- });
- ctx.lineWidth = 1;
- }
Run the SQL Script in your SQL Server to created DB, Table and stored procedure. Inweb.config change the connection string to your local SQL Server connection. In the attached zip file you can find code for Bar, Line and Pie, Bar& Line Chart.
Tested Browsers
- Chrome
- Firefox
- IE10
priyaPosted Jul 20, 2018, 2:01 AM
Please help...
priyaPosted Jul 20, 2018, 2:00 AM
Hi Shanu, I downloaded the code and get executed well but it does not show the chart. it shows blank screen where bar chart should populate.
farooq smdPosted Jun 21, 2016, 11:10 AM
nice
Mohammed IbrahimPosted Apr 8, 2016, 2:19 PM
nice
Rahul Kumar SaxenaPosted Apr 8, 2016, 7:41 AM
One more golden writing..