

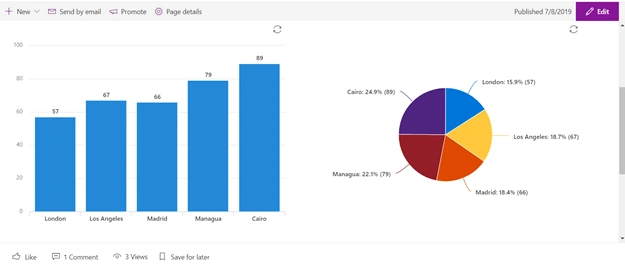
Quick Charts are a new addition to the targeted releases of modern web parts for SharePoint Online. It is a simple and easy-to-use web part to show data in the form of charts. Currently, it supports only two chart options,
- Column Chart
- Pie Chart
Along with static data, Quick Charts can also display data from the list. For instance, let us assume we have a list in SharePoint, “Weather List” with the below data.

Follow these steps to set up the charts.
Part I – Creating a Column Chart
- Create the list as shown in the screenshot above. Make sure that the list you create has a “Number” type column.
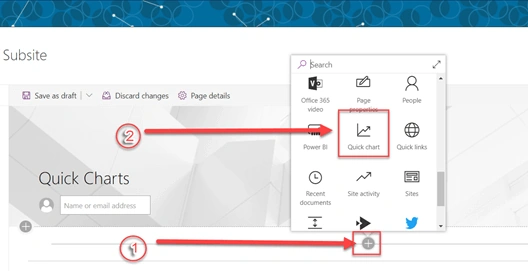
- Now, go to any page (modern page). Edit the page and search for the “Quick Chart” web part and add it.
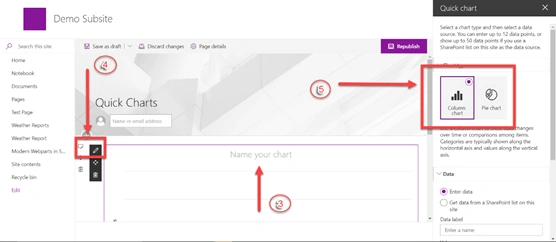
- The previous step will open add the quick chart web part, and you’re ready to customize it. Give it any name and click on the “Edit web part” option (depicted by point 4 below). This will open the Quick Chart configuration menu
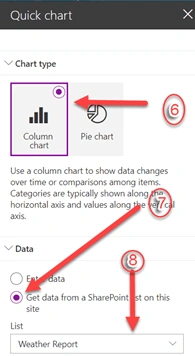
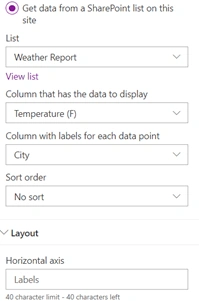
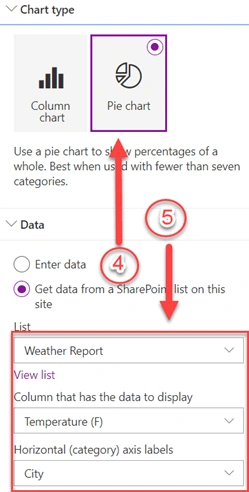
- Select the “Column” option from the Chart Type. In the section of Data, select the 2nd option to get the data from a live list on the site. Select the list from the dropdown.
- Now that the list is selected. Its time to select the actual data points. Go ahead and select the appropriate list columns for
- The column that has the data to display
- A column with labels for each data point
- Sort order
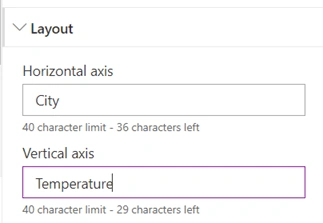
- You can make the chart a bit more informative by giving some names to the horizontal and vertical axes as shown below,
- This completes the steps for creating a Column chart in Quick chart. Now save and publish the page to see the changes.
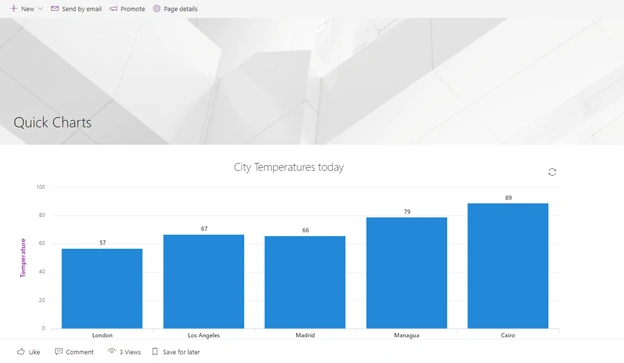
Part II – Creating a Column Chart
To demonstrate both the chart types together, we have broken down the existing web part zone into two sections. Also, for the sake of simplicity, we will be using the same list used in the previous example.
- To split the section into to, click on “Edit section” and select “Two Columns” from layout options. Now similar to Step 2 earlier, select “Quick Chart” and add it.
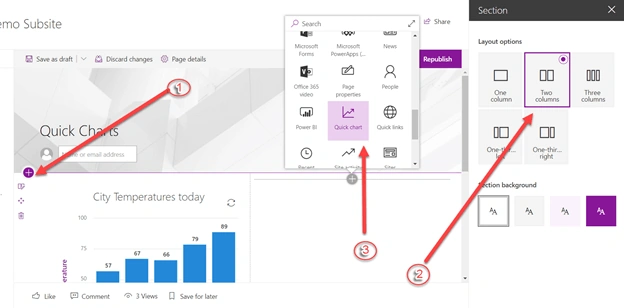
- Select the “Pie chart” option from Chart Type. Next, select the list and appropriate columns as shown below. Exit the web part editing section and re-publish the page. The pie chart will be updated.
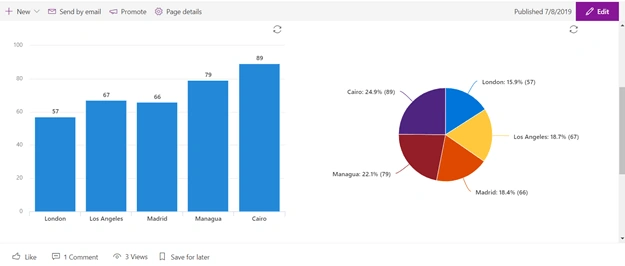
These conclude the steps. Both the charts will be reflected on the page. A screenshot of the same has been shown below.
A few observations on Quick Chart,
Pros
- Simple and easy to use 2-dimensional chart options in SharePoint that comes out of the box.
- Charts are responsive. Displays information on mouse hover
Cons
- The list will need to have a “Number” type column. Otherwise, it will not be identified in the dropdown of list selection in the Quick Chart Configuration menu
- Limited charts – only column and pie available. Also, no out of the box option for changing color schemes.
Melika ePosted Sep 30, 2020, 12:58 AM
Hi, How can I use this feature in SharePoint 2019?
Cad RiskPosted Feb 12, 2020, 3:26 PM
Hi there. Re; the "Select the option to Get data from a SharePoint list on this site, and then select the list.". The "Get data from a SharePoint list" if this option is not available in the edit menu, how do you enable this?