

An Introduction
This article is a walkthrough of creating a web application that displays a chart that is updated in real time. Using SignalR, the Chart data is kept synchronised throughout the connected clients. Chart data is sent from the Server to all the clients so that the Chart is displayed exactly similar to all.
Tools Used
- Visual Studio 2012
- SignalR
- Chart.js
About SignalR
SignalR is a server-side software system designed for writing scalable internet applications, notably web servers. Programs are written on the server side in C#, using event-driven, asynchronous I/O to minimize overhead and maximize scalability.
About Chart.js
Chart.js is a free chart tool available for a HTML5 browser with nice visualization and animation.
Read more about Chart.js here :
Download Chart.js from the preceding link.
Getting Started
Step 1
Creating a new web project in Visual Studio. I am using Visual Studio 2012.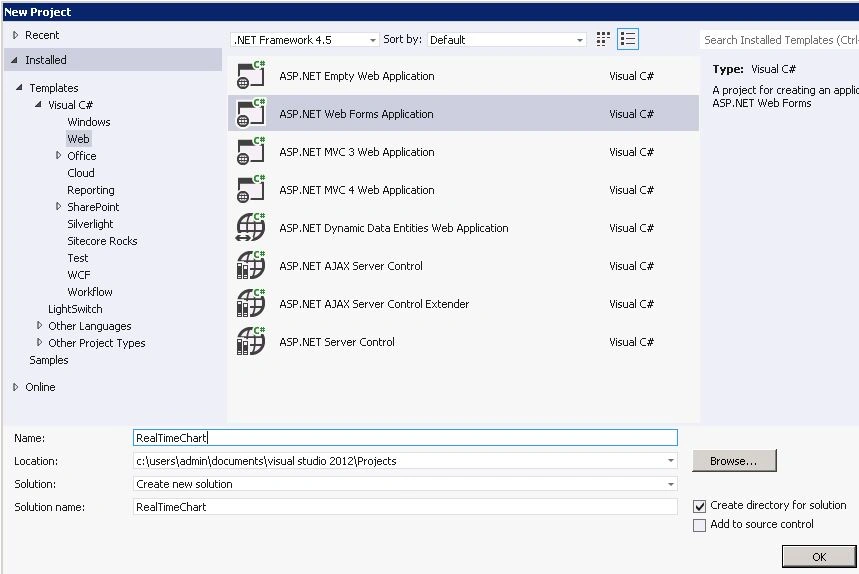
Step 2
Getting the Chart.js (download from the preceding link).
Add the Chart.js into the Scripts folder.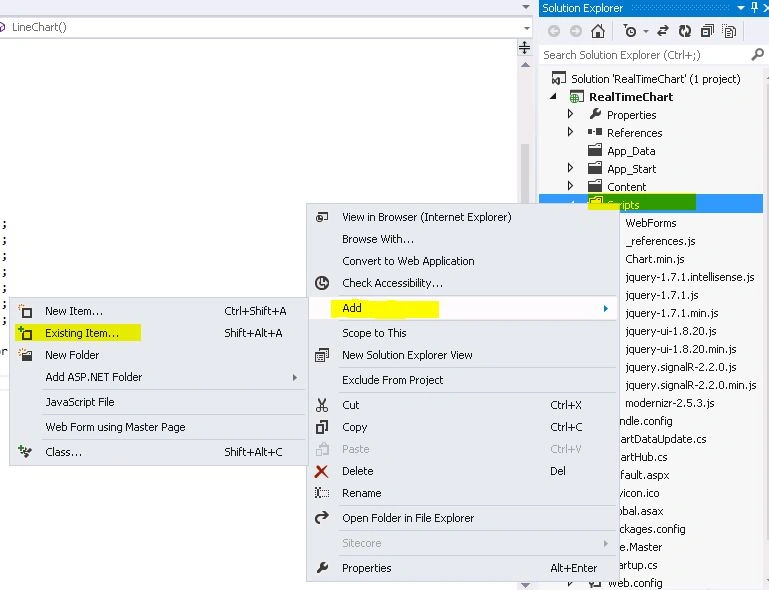
Step 3
Installing the SignalR.
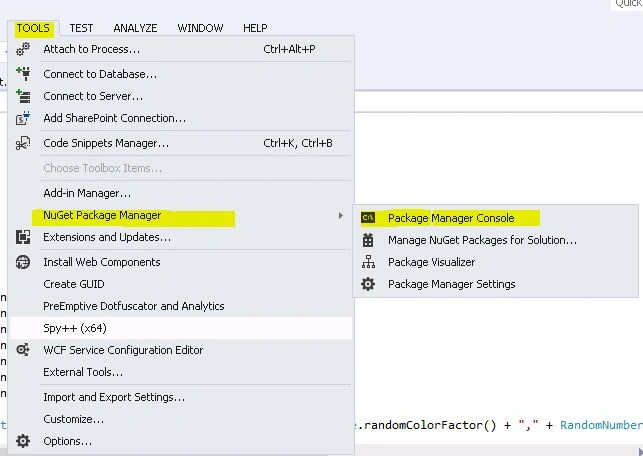
Click Tools then select Nuget Package Manager > Package Manager Console then type "install-package Microsoft.AspNet.SignalR".
- 4.1 Create the Chart Broadcaster Class. I have included all other required classes in this class only.
Right-click the Project folder then select Add > Class.. then type the class name as ChartDataUpdate.cs.
- using System;
- using System.Collections.Concurrent;
- using System.Collections.Generic;
- using System.Threading;
- using Microsoft.AspNet.SignalR;
- using Microsoft.AspNet.SignalR.Hubs;
- using Newtonsoft.Json;
- namespace RealTimeChart
- {
- //Other class will be added here
- public class ChartDataUpdate
- {
- }
- }
- public class RandomNumberGenerator
- {
- static Random rnd1 = new Random();
- static public int randomScalingFactor()
- {
- return rnd1.Next(100);
- }
- static public int randomColorFactor()
- {
- return rnd1.Next(255);
- }
- }
- //The Line Chart Class
- public class LineChart
- {
- [JsonProperty("lineChartData")]
- private int[] lineChartData;
- [JsonProperty("colorString")]
- private string colorString;
- public void SetLineChartData()
- {
- lineChartData = new int[7];
- lineChartData[0] = RandomNumberGenerator.randomScalingFactor();
- lineChartData[1] = RandomNumberGenerator.randomScalingFactor();
- lineChartData[2] = RandomNumberGenerator.randomScalingFactor();
- lineChartData[3] = RandomNumberGenerator.randomScalingFactor();
- lineChartData[4] = RandomNumberGenerator.randomScalingFactor();
- lineChartData[5] = RandomNumberGenerator.randomScalingFactor();
- lineChartData[6] = RandomNumberGenerator.randomScalingFactor();
- colorString = "rgba(" + RandomNumberGenerator.randomColorFactor() + "," + RandomNumberGenerator.randomColorFactor() + "," + RandomNumberGenerator.randomColorFactor() + ",.3)";
- }
- }
- 4.4 Add the PieChart class to the ChartDataUpdate.cs. This class has one property named "value". For this demo purpose I have taken only 3 values that will create 3 pie chart slices. The data is populated randomly.
- //The Pie Chart Class
- public class PieChart
- {
- [JsonProperty("value")]
- private int[] pieChartData;
- public void SetPieChartData()
- {
- pieChartData = new int[3];
- pieChartData[0] = RandomNumberGenerator.randomScalingFactor();
- pieChartData[1] = RandomNumberGenerator.randomScalingFactor();
- pieChartData[2] = RandomNumberGenerator.randomScalingFactor();
- }
- }
- Creates a Singleton Instance of this class
- Creates a Timer that runs the method ChartTimerCallBack every 5 seconds
- ChartTimerCallBack is a method that calls SendChartData that sets random data for the Line (SetLineChartData) and Pie (SetPieChartData) Chart and calls the client method UpdateChart
- Do note that the client method defined in the server class is in Title Case but when using it in the client JavaScript method it will be with camelCase. So UpdateChart will be refered to as updateChart in JavaScript.
- public class ChartDataUpdate
- {
- // Singleton instance
- private readonly static Lazy<ChartDataUpdate> _instance = new Lazy<ChartDataUpdate>(() => new ChartDataUpdate());
- // Send Data every 5 seconds
- readonly int _updateInterval = 5000;
- //Timer Class
- private Timer _timer;
- private volatile bool _sendingChartData = false;
- private readonly object _chartUpateLock = new object();
- LineChart lineChart = new LineChart();
- PieChart pieChart = new PieChart();
- private ChartDataUpdate()
- {
- }
- public static ChartDataUpdate Instance
- {
- get
- {
- return _instance.Value;
- }
- }
- // Calling this method starts the Timer
- public void GetChartData()
- {
- _timer = new Timer(ChartTimerCallBack, null, _updateInterval, _updateInterval);
- }
- private void ChartTimerCallBack(object state)
- {
- if (_sendingChartData)
- {
- return;
- }
- lock (_chartUpateLock)
- {
- if (!_sendingChartData)
- {
- _sendingChartData = true;
- SendChartData();
- _sendingChartData = false;
- }
- }
- }
- private void SendChartData()
- {
- lineChart.SetLineChartData();
- pieChart.SetPieChartData();
- GetAllClients().All.UpdateChart(lineChart,pieChart);
- }
- private static dynamic GetAllClients()
- {
- return GlobalHost.ConnectionManager.GetHubContext<ChartHub>().Clients;
- }
- }
Create the Chart Hub Class.
Right-click the Project folder then seelct Add > Class.. then type the class name as ChartHub.cs.
- using System;
- using System.Collections.Generic;
- using System.Linq;
- using System.Web;
- using Microsoft.AspNet.SignalR;
- namespace RealTimeChart
- {
- public class ChartHub : Hub
- {
- // Create the instance of ChartDataUpdate
- private readonly ChartDataUpdate _ChartInstance;
- public ChartHub() : this(ChartDataUpdate.Instance) { }
- public ChartHub(ChartDataUpdate ChartInstance)
- {
- _ChartInstance = ChartInstance;
- }
- public void InitChartData()
- {
- //Show Chart initially when InitChartData called first time
- LineChart lineChart = new LineChart();
- PieChart pieChart = new PieChart();
- lineChart.SetLineChartData();
- pieChart.SetPieChartData();
- Clients.All.UpdateChart(lineChart,pieChart);
- //Call GetChartData to send Chart data every 5 seconds
- _ChartInstance.GetChartData();
- }
- }
- }
Create the OWIN Startup Class.
Right-click the Project folder then seelct Add > Class.. then type the class name as Startup.cs.
- using System;
- using Microsoft.Owin;
- using Owin;
- [assembly: OwinStartup(typeof(RealTimeChart.Startup))]
- namespace RealTimeChart
- {
- public class Startup
- {
- public void Configuration(IAppBuilder app)
- {
- // Any connection or hub wire up and configuration should go here
- app.MapSignalR();
- }
- }
- }
Create the Startup aspx page. I have used the default.aspx page.
First add a reference to jQuery and Chart.js as in the following:
- <script src="Scripts/jquery-1.7.1.min.js" type="text/javascript"></script>
- <script src="Scripts/Chart.min.js" type="text/javascript"></script>
Then add a reference to the required SignalR JavaScript files as in the following:
- <script src="Scripts/jquery-ui-1.8.20.min.js"></script>
- <script src="Scripts/jquery.signalR-2.2.0.min.js"></script>
- <script src="/signalr/hubs"></script>
Add a Canvas area where the Line and Pie charts will be displayed as in the following:
- <table style="width: 100%">
- <tr>
- <td style="width: 50%; text-align: center">
- <canvas id="canvasForLineChart" height="200" width="400">Chart is Loading...</canvas>
- </td>
- <td style="width: 50%; text-align: center">
- <canvas id="canvasForPieChart" height="200" width="400">Chart is Loading...</canvas>
- </td>
- </tr>
- </table>
- <script>
- function checkHTML5() {
- var canvasForLineChart = document.getElementById("canvasForLineChart");
- if (canvasForLineChart == null || canvasForLineChart == "") {
- document.write("Browser doesn't support HTML5 2D Context");
- return false;
- }
- if (canvasForLineChart.getContext) {
- }
- else {
- document.write("Browser doesn't support HTML5 2D Context");
- return false;
- }
- }
- $(function () {
- //If not HTML5 Support the Exit
- if (checkHTML5() == false) return;
- //Create the Hub
- var chartHub = $.connection.chartHub;
- //Call InitChartData
- $.connection.hub.start().done(function () {
- chartHub.server.initChartData();
- });
- //Call to Update LineChart from Server
- chartHub.client.updateChart = function (line_data,pie_data) {
- UpdateLineChart(line_data); //Call the LineChart Update method
- UpdatePieChart(pie_data); //Call the PieChart Update method
- };
- });
- </script>
The UpdatePieChart and UpdateLineChart methods are used to update and recreate both the charts.
- <script type="text/javascript">
- ////////////////////////////////////////////////////////////////////////////////////////////////////////
- //Line Chart JSON Config (Line Chart Has fixed 1 data series here)
- var lineChartData = {
- labels: ["January", "February", "March", "April", "May", "June", "July"],
- datasets: [
- {
- fillColor: "",
- data: [0]
- }
- ]
- }
- //Pie Chart JSON Config (Pie Chart Has fixed 3 Values/Slices here)
- var pieChartdata = [
- {
- value: 0,
- color: "#F7464A",
- label: "East"
- },
- {
- value: 0,
- color: "#46BFBD",
- label: "West"
- },
- {
- value: 0,
- color: "#FDB45C",
- label: "North"
- },
- {
- value: 0,
- color: "#FE94DC",
- label: "South"
- }
- ]
- ////////////////////////////////////////////////////////////////////////////////////////////////////////
- //PieChart Update method
- function UpdatePieChart(data) {
- //Set data returned from Server
- pieChartdata[0].value = data.value[0];
- pieChartdata[1].value = data.value[1];
- pieChartdata[2].value = data.value[2];
- //Update the Line Chart
- var canvasForPieChart = document.getElementById("canvasForPieChart");
- var context2DPie = canvasForPieChart.getContext("2d");
- new Chart(context2DPie).Pie(pieChartdata);
- }
- //LineChart Update method
- function UpdateLineChart(data) {
- //Set data returned from Server
- lineChartData.datasets[0].fillColor = data.colorString;
- lineChartData.datasets[0].data = data.lineChartData;
- //Update the Pie Chart
- var canvasForLineChart = document.getElementById("canvasForLineChart");
- var context2DLine = canvasForLineChart.getContext("2d");
- new Chart(context2DLine).Line(lineChartData);
- }
- </script>
The full version of ChartDataUpdate.cs, ChartHub.cs and Default.aspx can be found in the download source.
Build and Run. To test, open multiple HTML5 compatible browsers.
The Output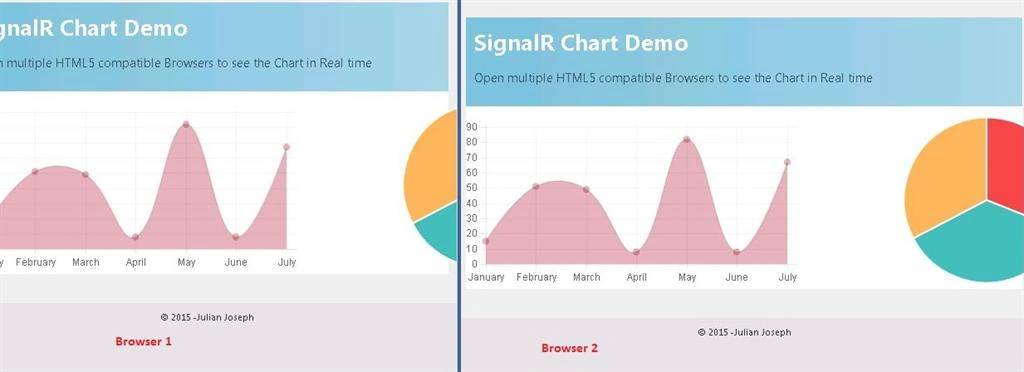
Limitations
- In Firefox the Pie chart is not rendering properly.
- I tested in Chrome only.
Have a nice Day. :-)
FaisalPosted Jul 7, 2020, 5:13 AM
Sir , how to connect database here with the chart ?
Mohamed ElyamaniPosted Nov 7, 2019, 1:02 AM
How can i make the timer global on all session to avoid DB load , if any one calls it once and will send the data to everyone not to make timer for every user while invoking the hub method
trần KhánhPosted Aug 12, 2018, 10:21 AM
Hello. thanks code. but i want change to chart candlestick. how to i make it.
taha temuriPosted Jul 9, 2017, 10:47 AM
You forgot to inherit you ChatHub class with Hub
Xiao JerryPosted Jun 14, 2015, 11:40 PM
What is the difference between Chart.js and HighCharts.js?
NitinPosted May 8, 2015, 12:18 PM
nice
Sibeesh VenuPosted May 8, 2015, 7:06 AM
Good one .
Santhakumar MunuswamyPosted May 7, 2015, 3:35 PM
Thanks for nice article