

As promised in my previous article on “SharePoint 2013 : How to enable PowerPivot Excel Plugin for Excel 2013”, I am here with a new article that shows a demonstration on leveraging Excel PowerPivot Plugin, in order to prepare the reports consuming data from SQL Server.
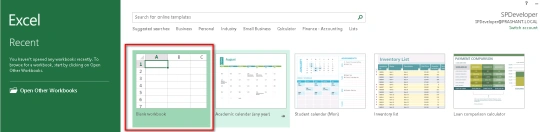
- Launch Excel 2013.
- Select Blank Workbook.
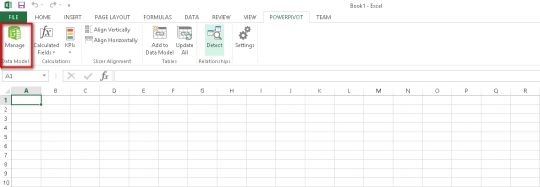
- Select POWERPIVOT Tab.
- Select Manage.
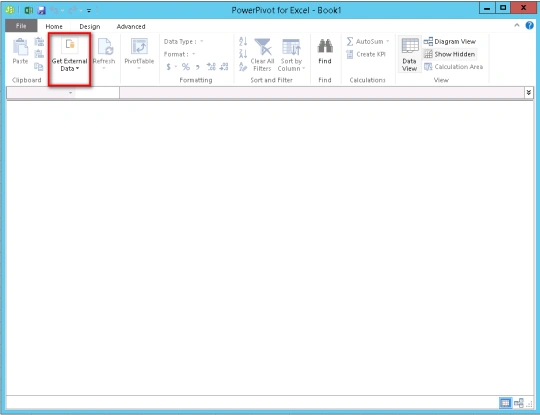
- Click on “Get External Data” Dropdown Ribbon Button.
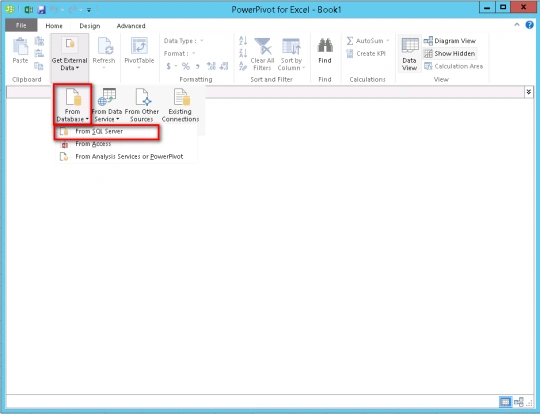
There, we can see all the Data Sources that can be used to connect with.
- Select “From Database” to setup a connection with SQL Server.
- Select SQL Server Instance Name.
Wait for further processing.
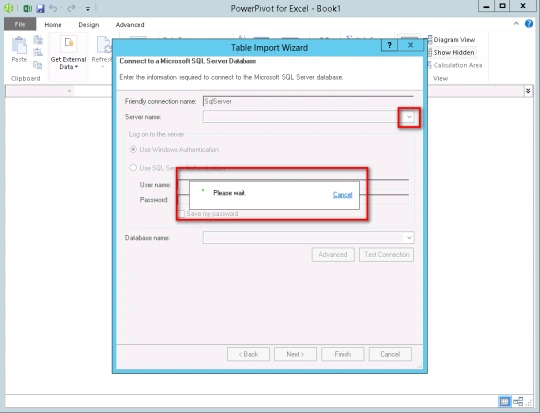
- Select the Database Name.
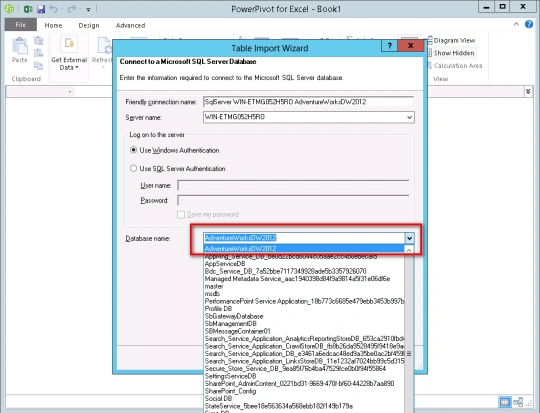
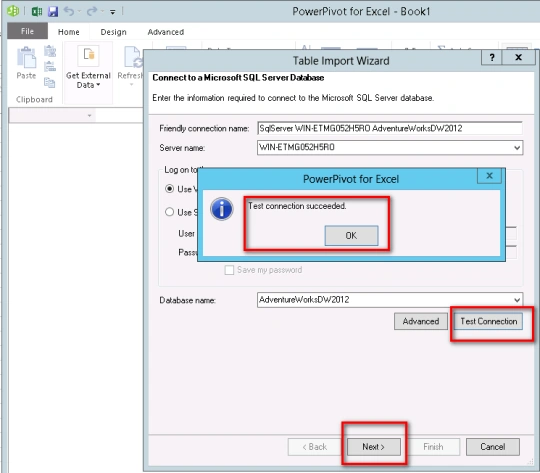
- Test the connection.
- If the connection succeeds, click Next.
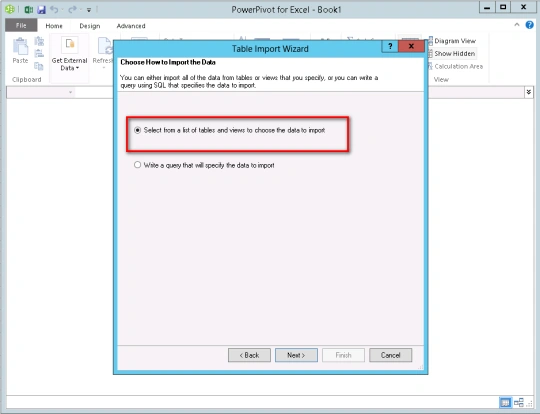
In the next step, you can choose either of the two options.
- Select Tables or View from the Look List.
- Write down your own Query to execute directly and fetch the result set in the form of a table.
However, as a part of good practice it would always be a good idea to proceed with option 1 as we are going to do it hereafter.
- Select Option 1, as shown below.
- Select the required Tables from the Look up Window to participate in the read operation.
- Then, click Finish
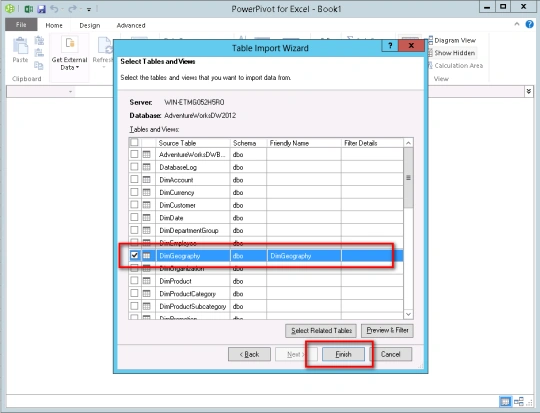
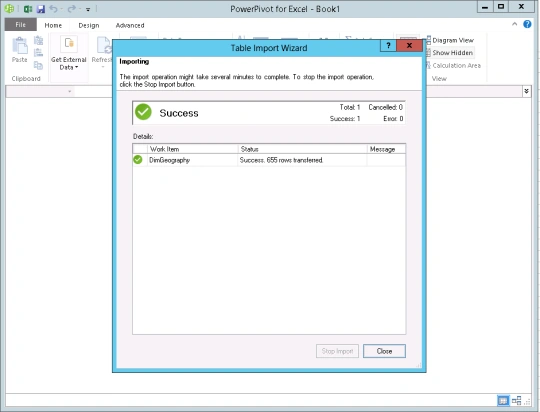
- If all goes fine, we can see the Success screen.
- Click Close button.
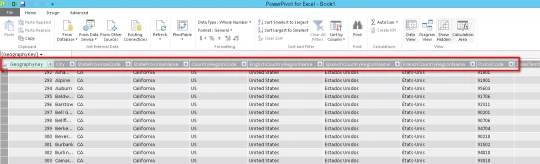
And, we can get the selected Tables exported to the Excel, presenting data to be consumed as needed after.
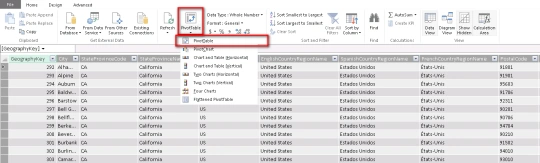
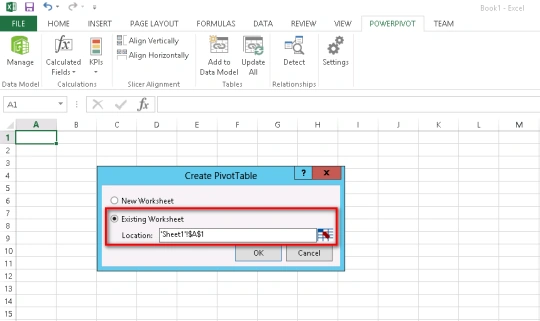
- Now, choose “PivotTable” from “PivotTable” Dropdown Ribbon Menu.
Provide the Data Range to be consumed by Pivot Table.
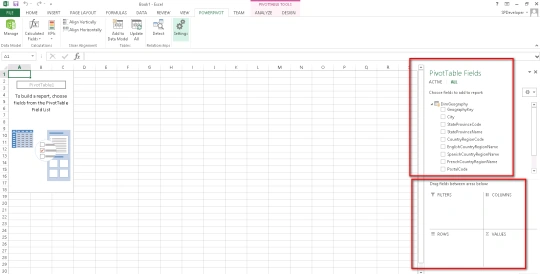
And sure enough, you will see the Pivot Table with Fields available for the selection.
We can include different Operations as needed afterwards.
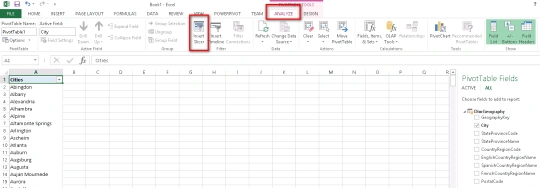
For instance, we can provide Data Slicers to the Users to allow them to get filtered Views of the data as needed.
- In order to Add Slicer, click on Analyze Tab.
- Then Click Insert Slicer,
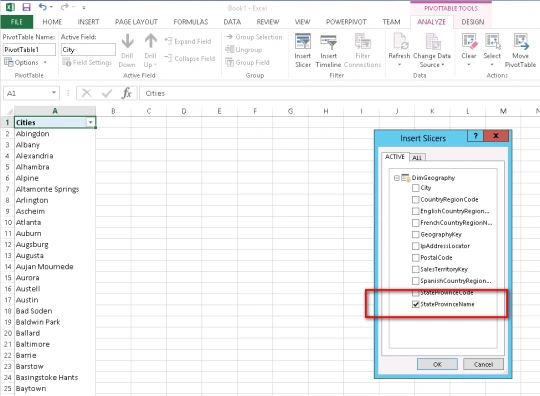
- Choose a relevant Filter Parameter or Slicer based on which Users you want to allow to Filter the data.
Here, we are choosing “StateProvinceName” as Slicer.
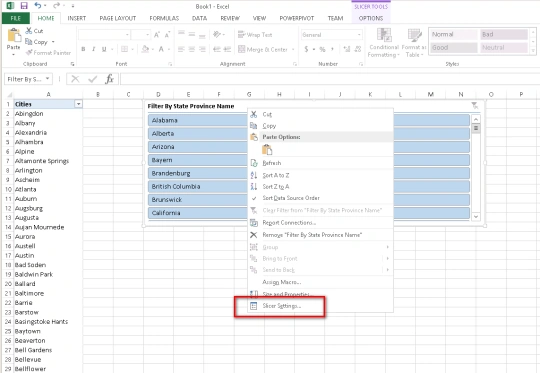
- Go to Slicer Settings to provide an appropriate name to the Slicer.
- Right click on Slicer.
- Select Slicer Settings from the Context Menu.
- Specify the Caption for the Slicer,
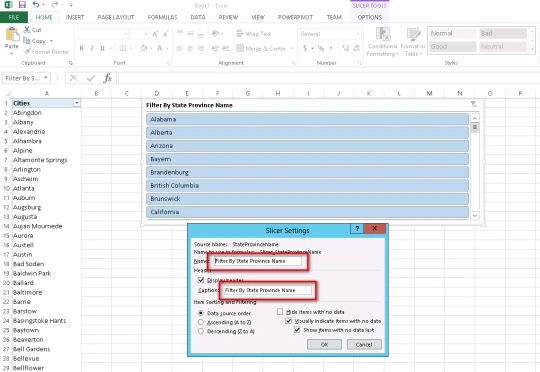
- Once this is all done, we would be having a fully functional PowerPivot Report to be published for the Users.
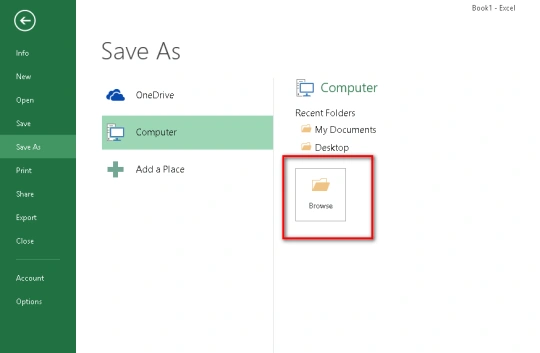
- Go To File Menu.
- Select Save As.
- Click on Browse button.
- Specify the URL of Document Library where you want to Publish this file.
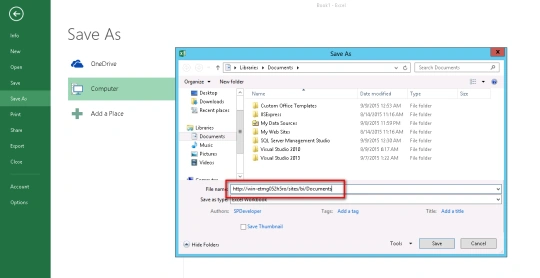
- Browse the Document Library.
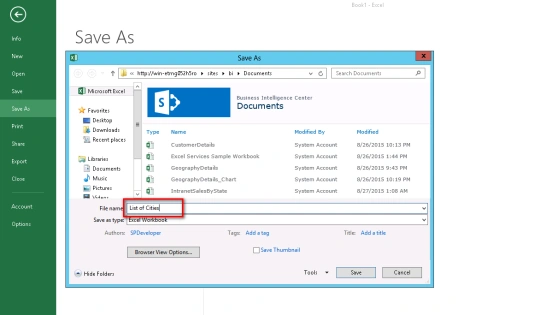
- Specify the name of the file to be Published.
And, Save it.
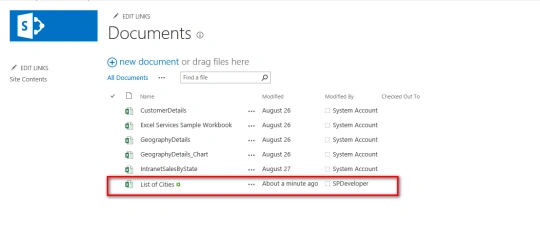
- Browse the Document Library and see if the file is published properly.
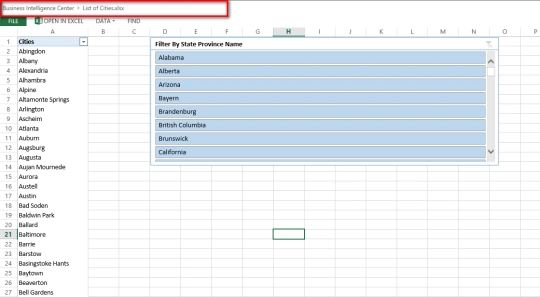
- Click on the Report and let it run in Browser. Sure enough, we will see the List of Cities with a “State Province Name” Filter (Slicer) in action.
This is no code implementation of quite an effective Reporting solution backed up by rich PowerPivot functionality.
Hope you find it helpful.
Prashant BansalPosted Jul 14, 2017, 12:39 PM
Glad you all find it helpful.
Humayun Kabir MamunPosted Sep 21, 2016, 12:41 AM
Very helpful...
Prasanna MuraliPosted Sep 20, 2016, 9:32 PM
Nice share
Vignesh ManiPosted Sep 20, 2016, 6:10 PM
Nice One