

One of the teething issues with Enterprise SharePoint solutions is performance. There are several tools such as SP Dispose checker, Health Analyzer and Diagnostics studio that are available in SharePoint to help in keeping a tab on performance issues.
In this article, we will look at one such tool - the SharePoint Developer Dashboard and analyze a scenario using the dev dashboard.
What is it?
The developer dashboard is a new feature in SharePoint 2010 providing information on the application performance assisting us in debugging issues related to performance. This feature, when enabled, displays the tracing information at the end of every page that is rendered. One thing to note though is that this can only be used when the page does not error out completely. i.e., the page must be rendered without any errors. In case of pages that error out for some issue, we have to go back to the ULS logs to figure out the cause of the failure.
Turning it on:
By default, this feature is turned off. This can be turned on by:
- STSADM:
STSADM -o setproperty -pn developer-dashboard -pv <Mode>
<Mode> can take the values
- "Off" - Disabled
- "On"- Enabled on all pages
- "OnDemand" - User can launch the dashboard by clicking on an icon in the page. The user browsing the page must have the AddAndCustomizePages permission
- "expensiveoperationsonly" - Turned on for pages where one or more counters (acceptable values) are exceeded
- Powershell
$DevDashboardSettings = [Microsoft.SharePoint.Administration.SPWebService]::ContentService.DeveloperDashboardSettings; $DevDashboardSettings.DisplayLevel = <Mode>;$DevDashboardSettings.TraceEnabled = $true; $DevDashboardsettings.Update();
- Using Code - We can write SharePoint code using Object Model to activate the developer dashboard. The code snippet would resemble this:
using Microsoft.SharePoint.Administration;
SPWebService svc = SPContext.Current.Site.WebApplication.WebService;
svc.DeveloperDashboardSettings.DisplayLevel = SPDeveloperDashboardLevel.<mode>;
svc.DeveloperDashboardSettings.Update();
The screenshot below shows a page with DDB enabled in "OnDemand" mode. All the further sections are also based on DDB in "OnDemand" mode.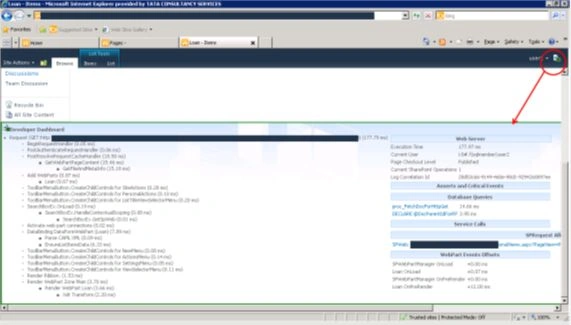
What information do I get?
The information displayed in the dashboard is categorized as:
- Information on how long it took for the request to be processed
- Events that were fired in the course of the request & how long each of them took to be processed - By default metrics for only "OnInit" and "Render " methods are recorded here. To have any other custom code monitored, we would need to wrap it up in "SPMonitoredScope". One more exception is that code in Sandbox components cannot be included for monitoring here. The reason is the tool is designed to read information from the process - "w3wp.exe" and does not have the ability to pick up information from the sandbox worker process - "SPUCWorkerprocess.exe "
- Correlation ID in the Log
- Asserts and any Critical Events - Displays entries from ULS logs where trace levels are Asserts & Critical.
- Database Queries - what queries had to be run to perform the last action on the site. Also provides details of the query and parameters supplied.
- Service Calls - Displays calls to web services (WCF)
- SharePoint Request Allocations - Displays the number of SPRequest objects allocated during the operation. A high number here indicates that a large number of SPSites and SPobjects were used, which can adversely affect memory use on the server.
- WebPart Event Offsets - Displays the timing offset of the event within a web part since its parent event (. SPWebPartManager OnLoad) fired.
Scenario
One of the Microsoft recommendations for performance improvement in SharePoint is to have BLOB cache enabled for the web applications. Let us analyze an application before and after enabling blob cache using the developer dashboard.
- We will first look at the page without ANY customizations applied.
The Dev Dashboard output of the page before the BLOB Cache is: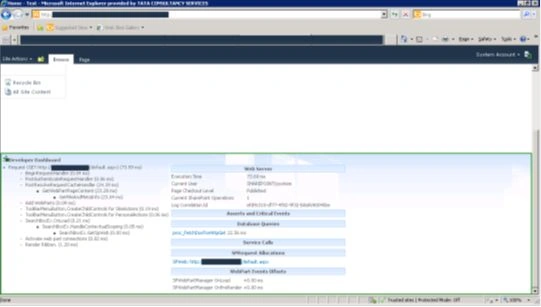
The Dev Dashboard output for the Page After BLOB Cache :
First Hit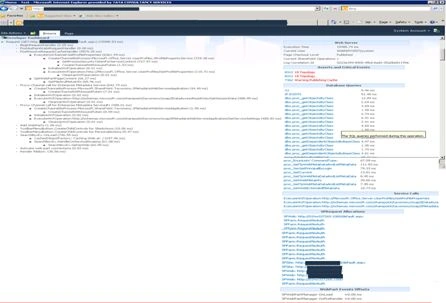
Second Hit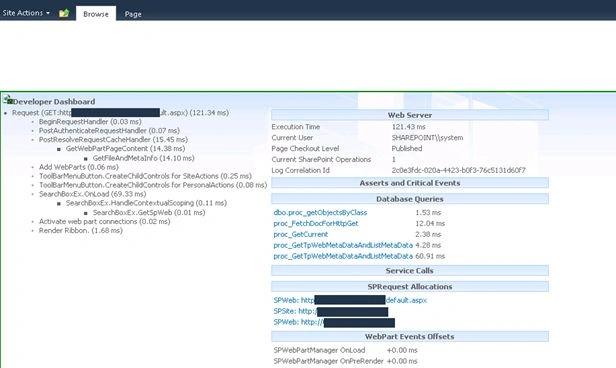
Third Hit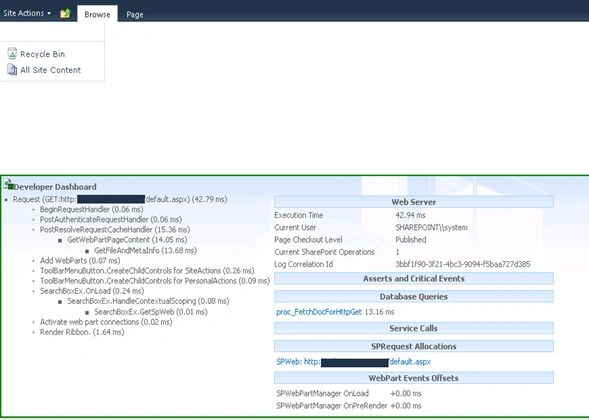
Conclusion
- We see that without enabling the BLOB cache, the request took about 74ms. After enabling the BLOB Cache, the first hit took about 15985ms, the second about 121 ms and the subsequent hits took about 43ms.
- Looking at the assets and critical events sections on the first hit after enabling the BLOB cache, we can see a warning message - that says "7362 Warning Publishing Cache". Clicking on the message, we get some more detailed information as below:
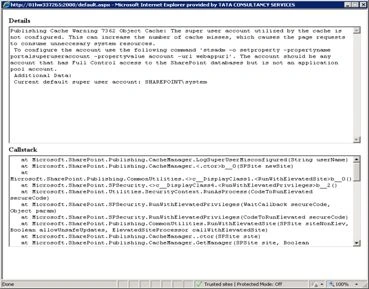
We also see quite a few DB calls and SPRequest allocations in the first hit that explains the reason for the increased time to serve the request.
- We see that there is one query "proc_FetchDocForHttpGet" that gets fired (before and after enabling the BLOB cache), although it takes much less time after enabling the BLOB cache. The events PostResolveRequestCacheHandler, GetWebPartPageContent and GetFileAndMetaInfo too take much lesser time after enabling BLOB cache.
We should keep in mind that, these queries, events and SPrequests would keep changing for every page request, depending on the components on the page and the action performed immediately before looking at the dashboard.
In a similar fashion, we can also determine the details of a page with customizations applied and pages with custom web parts. Thus, we can analyze our application to a fair depth using the developer dashboard and fine tune the configurations and code to improve performance.
Gowtham RajamanickamPosted Apr 21, 2015, 1:08 AM
great one
Dinesh BeniwalPosted Jul 11, 2012, 6:06 AM
Thanks for sharing.