

Introduction
This article demonstrates how to send the temperature data into the cloud via Azure IoT Hub and PowerBI.
Requirement
- DHT11 - Temperature and Humidity Sensor Module
- Azure Subscription
- Analysis - IoT - Hub (8,000 messages per day)
- Power PI Account
- Raspberry Pi
- Stream Analytics Job
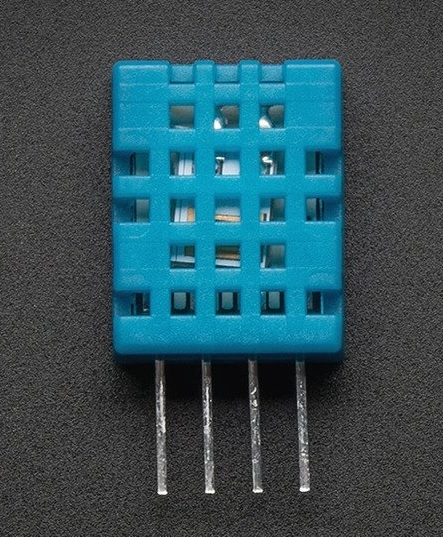
DHT11 - Temperature and Humidity Sensor Module
The DHT11 humidity and temperature sensor make it really easy to add humidity and temperature data to your IoT Hub.
| Item | Measurement Range |
Humidity Accuracy
|
Temperature
Accuracy
|
Resolution | Package |
| DHT11 | 20-90%RH 0-50 ℃ | ±5%RH | ±2℃ | 1 | 4 Pin Single Row |
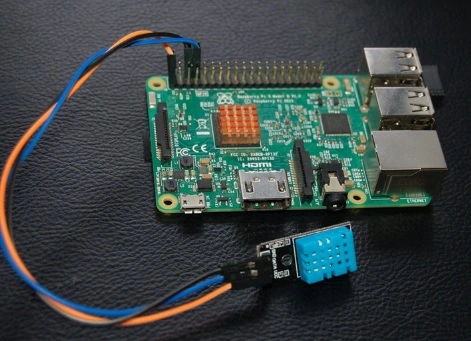
Raspberry Pi and dh11 interconnection diagram
Step 1
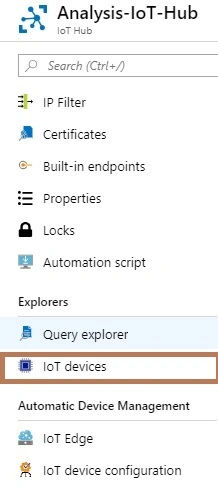
- Navigate to IoT devices within your IoT Hub.
- Click "Add".
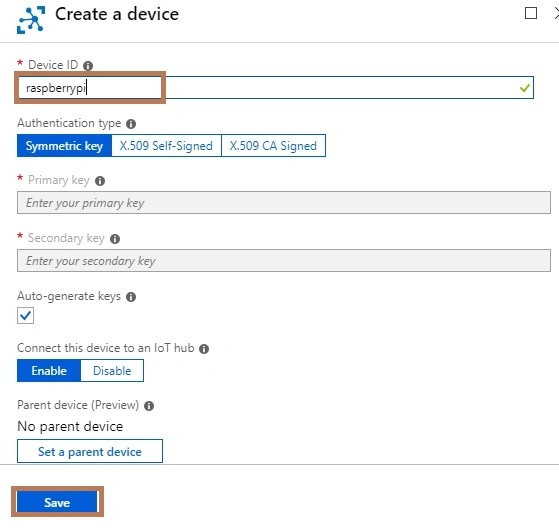
- Populate the Device ID (e.g. raspberrypi).
- Click "Save".
Create an IoT device named as "raspberrypi" and select the authentication type.
Create a Consumer Group
- Navigate to Endpoints within your IoT Hub.
- Click on the Events (messages/events) endpoint.
- Add a Consumer Group (e.g. streamanalytics_consumergroup).
- Click "Save".
Step 2
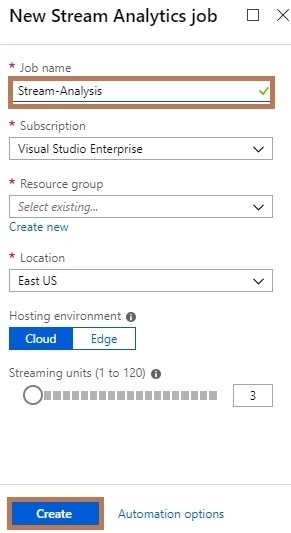
- Create a Stream Analytics job; the job name is Stream - Analysis.
Step 3
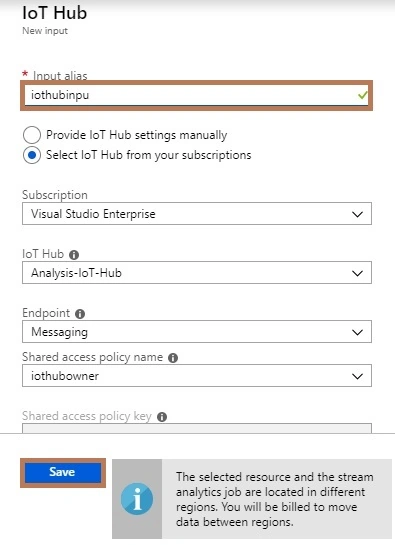
- Navigate to Input alias.
- Select IoT Hub from your subscriptions.
- Add a Consumer Group (e.g. streamanalytics_consumergroup).
- Endpoint (ex: Message).
- Click "Save".
Step 4
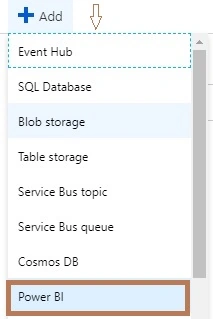
- Navigate to Outputs.
- Click Add > Power BI.
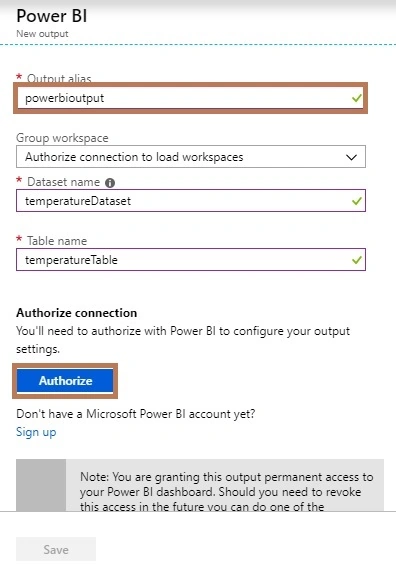
- Output alias (e.g. powerbioutput).
- Dataset Name (e.g. temperatureDataset).
- Table Name (e.g. temperatureTable).
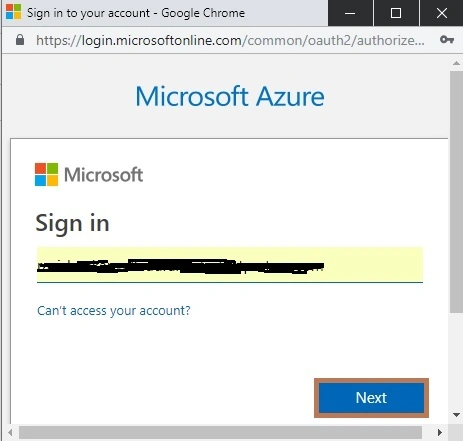
- Click "Authorize".
- Click "Save".
Stream Analytics SQL
- Navigate to Query within Stream Analytics.
- Copy and paste the SQL below into your Stream Analytics query window.
- Sample data has returned, click "Test".
- Click "Save".
- Click "Start".
- SELECT
- CAST(iothub.EnqueuedTime AS datetime) AS event_date,
- CAST(temp AS float) AS temp
- INTO
- powerbioutput
- FROM
- iothubinput
Source Code (Python)
- from base64 import b64encode, b64decode
- from hashlib import sha256
- from urllib import quote_plus, urlencode
- from hmac import HMAC
- import requests
- import json
- import os
- import time
- # Temperature Sensor
- BASE_DIR = '/sys/bus/w1/devices/'
- SENSOR_DEVICE_ID = 'YOUR_DEVICE_ID'
- DEVICE_FILE = BASE_DIR + SENSOR_DEVICE_ID + '/w1_slave'
- # Azure IoT Hub
- URI = 'YOUR_IOT_HUB_NAME.azure-devices.net'
- KEY = 'YOUR_IOT_HUB_PRIMARY_KEY'
- IOT_DEVICE_ID = 'YOUR_REGISTED_IOT_DEVICE_ID'
- POLICY = 'iothubowner'
- def generate_sas_token():
- expiry=3600
- ttl = time.time() + expiry
- sign_key = "%s\n%d" % ((quote_plus(URI)), int(ttl))
- signature = b64encode(HMAC(b64decode(KEY), sign_key, sha256).digest())
- rawtoken = {
- 'sr' : URI,
- 'sig': signature,
- 'se' : str(int(ttl))
- }
- rawtoken['skn'] = POLICY
- return 'SharedAccessSignature ' + urlencode(rawtoken)
- def read_temp_raw():
- f = open(DEVICE_FILE, 'r')
- lines = f.readlines()
- f.close()
- return lines
- def read_temp():
- lines = read_temp_raw()
- while lines[0].strip()[-3:] != 'YES':
- time.sleep(0.2)
- lines = read_temp_raw()
- equals_pos = lines[1].find('t=')
- if equals_pos != -1:
- temp_string = lines[1][equals_pos+2:]
- temp_c = float(temp_string) / 1000.0
- return temp_c
- def send_message(token, message):
- url = 'https://{0}/devices/{1}/messages/events?api-version=2016-11-14'.format(URI, IOT_DEVICE_ID)
- headers = {
- "Content-Type": "application/json",
- "Authorization": token
- }
- data = json.dumps(message)
- print data
- response = requests.post(url, data=data, headers=headers)
- if __name__ == '__main__':
- # 1. Enable Temperature Sensor
- os.system('modprobe w1-gpio')
- os.system('modprobe w1-therm')
- # 2. Generate SAS Token
- token = generate_sas_token()
- # 3. Send Temperature to IoT Hub
- while True:
- temp = read_temp()
- message = { "temp": str(temp) }
- send_message(token, message)
- time.sleep(1)
Step 5 - Power BI
- Log on to Power BI.
- Create a new dashboard.
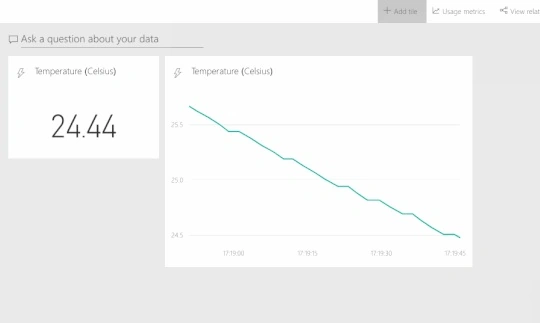
- Add two tiles.
Card
- Click "Add tile" >> "Custom Streaming Data" >> "Next".
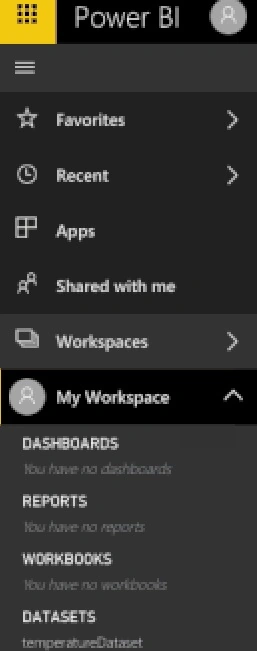
- Select the temperatureDataset
Properties.
- Visualization Type: Card
- Fields: temp
- Decimal Places: 2
- Title: Temperature
Line Chart
- Click Add tile.
- Click Custom Streaming Data.
- Click Next.
- Select temperatureDataset.
Properties.
- Visualization Type: Line chart
- Axis: event_date
- Values: temp
- Time window: 1 minute
- Title: Temperature (Celsius)
OUTPUT
Summary
Finally, we have successfully created a graph that streams the sensor data in real-time with IoT Hub using Powe BI.
Join the conversation! Your thoughts help the community grow.