
Creating a Chart on ASP. NET 4.0
Steps of Creating a Chart
Step 1: Open Microsoft Visual Studio 4.0
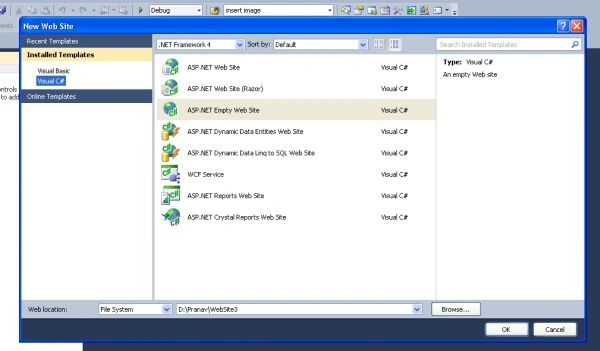
Step2: Select File->>New ->>Website

Step3: Select ASP. NET Empty Web Site
Step4: Add New Item

Step5: Select Item Web Form

Step6 : Drag the chart from data from the toolbox to the design form and drop there.
Choose your graph like pie , column , bubble etc.
Here for example we take a Column Chart.

Step 7: Go to a source panel of a chart and write a coding there as per requirement.
For example the code is given below
Here is the code using Script:
<body>
<form id="form1" runat="server">
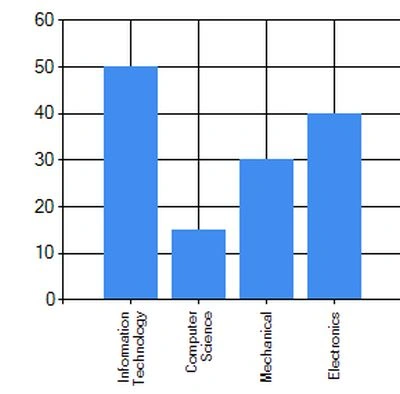
<div<asp:DataPoint AxisLabel="Information Technology" YValues="50" />
<asp:DataPoint AxisLabel="Computer Science" YValues="15" />
<asp:DataPoint AxisLabel="Mechanical " YValues="30" />
<asp:DataPoint AxisLabel="Electronics" YValues="40" />
</Points>
</asp:Series>
</Series>
<ChartAreas>
<asp:ChartArea Name="ChartArea">
</asp:ChartArea>
</ChartAreas>
</asp:Chart>
</div>
</form>
</body>
The output of the code is give below:
.
Conclusion:
As the Chart is a good approach to understand the organization. So it is an important tool to implement in the project. To make the analysis of an organization effective.
VenkiPosted Jul 10, 2014, 12:36 AM
http://www.fourthbottle.com/2014/06/create-charts-with-aspnet-and-c.html
Pradeep VishwakarmaPosted Jul 4, 2014, 2:07 AM
Sir Please download tools
Vineet Kumar SainiPosted Dec 12, 2012, 3:27 AM
Dear Pranav Kumar Sharma, Please tell me how to create pie chart in asp.net 4.0 ?