

Problem: Some time we need to have different color on each bar.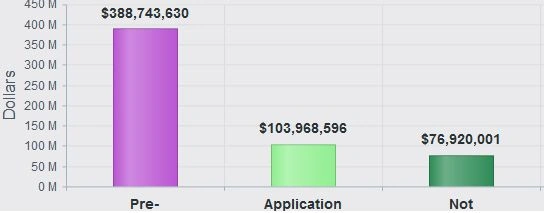
To achieve this I used kendo UI control. First of all you need to add required kendo reference. Then follow below steps.
Html Code:
- <div id="chart" style="width: 873px; height: 300px;">
- </div>
- //define your data here colorField is responsible changing the color of each bar
- var Pipelinedata = [{
- Name: "Pre",
- Value: 123,
- valueColor: "#BA55D3"
- }, {
- Name: "Application",
- Value: 124,
- valueColor: "#90EE90"
- }, {
- Name: "Not,
- Value: 35345,
- valueColor: "#DC143C"
- }
- ];
- art").kendoChart({
- theme: "silver",
- title: {
- text: "abc "
- },
- dataSource: {
- data: Pipelinedata
- },
- transitions: false,
- series: [{
- type: "column",
- field: "Value",
- colorField: "valueColor",
- labels: {
- visible: true,
- format: "{0:c0}"
- }
- }],
- categoryAxis: {
- field: "Name",
- labels: {
- color: "#293135"
- }
- },
- valueAxis: {
- labels: {
- template: "#= kendo.format('{0:N0}', value) # "
- },
- title: {
- text: "Dollars"
- }
- },
- tooltip: {
- visible: true,
- template: "#=kendo.format('{0:c0}', value)# "
- }
- });
Thanks
Kamal Samant
Join the conversation! Your thoughts help the community grow.