This article discusses various ways to improve the performance of WP7 apps.
Introduction
Silverlight and a mobile device - the combination that would be considered impossible not so long ago. The reason is simple - Silverlight with all its flexibility demands high computational power.
So how does the reality look after the WP7 devices are in use for a couple of months?
We'll be talking about the performance. Ok, but what does it mean - performance?
Most users - when they see nothing changed for 2 seconds - assume something is broken and act correspondingly. You have two options to handle this situation:
- Making your app acting faster, i.e. improve the real performance.
- Making your app appear faster, i.e. improve the perceived performance.
In fact, positive perceived performance is one of the central requirements when submitting apps to the WP7 market place. The app should never appear irresponsive; you need to entertain the user during lengthy computation, show some action, animations etc.
In the following we'll be talking about various ways to improve the performance. Then we'll try to demonstrate these general points on concrete examples.
Prerequisites
The target audience is a C# .NET programmer with a reading knowledge of Silverlight. At the very minimum the reader should understand basic Silverlight controls and layout.
You need to have installed Windows Phone Developer Tools.
How to analyze performance
Problems
One important issue concerns the time measurement. Unfortunately, WP7 Silverlight can measure only milliseconds. This means that any results must be taken with a grain of salt. The smaller the method, the more difficult is the performance measurement.
Second big problem is the randomness introduced (for example) by garbage collectors. To reduce this effect, the profiling should be repeated several times.
Manual measurement
If you know where the problem lies, you can measure yourself, for example using this code:
GC.Collect(); // Optional; reduces the randomness of the garbage collector
int startTime = Environment.TickCount;
//.... measured code ...
Debug.WriteLine("{0} msec", Environment.TickCount - startTime);
// You could also use the Stopwatch class to measure the time it takes.
Below is a handy class that can be used for manual measurements:
/// A simple profiling tool. Represents single instance of the standard StopWatch class.
/// Remarks: All methods are compiled conditionally in the DEBUG mode.
public class DebugWatch
static private System.Diagnostics.Stopwatch m_watch;
static private void AssertValid() {
if (m_watch == null)
m_watch = new System.Diagnostics.Stopwatch();
}
/// <summary>Resets time measurement.</summary>
[System.Diagnostics.Conditional("DEBUG")]
static public void Reset() {
m_watch = null;
}
/// <summary>Starts time measurement.</summary>
[System.Diagnostics.Conditional("DEBUG")]
static public void Start() {
AssertValid();
m_watch.Start();
}
/// <summary>Stops time measurement</summary>
[System.Diagnostics.Conditional("DEBUG")]
static public void Stop() {
AssertValid();
m_watch.Stop();
}
/// <summary>Outputs the specified prompt followed by " n msec".</summary>
/// <param name="prompt">The prompt.</param>
[System.Diagnostics.Conditional("DEBUG")]
static public void Print(string prompt) {
AssertValid();
System.Diagnostics.Debug.WriteLine("{0} {1} msec", prompt, m_watch.ElapsedMilliseconds);
}
}
How to measure the time needed to instantiate a control.
You can start the time measurement in the control constructor and measure the time elapsed in these places:
- Loaded event handler: At this moment the control is constructed and added to the object tree; the style is applied.
- OnApplyTemplate(): Template applied.
- SizeChanged or LayoutUpdated event handler: Layout completed.
This way you'll be able to say which part of the control construction takes the most time.
Using the profiler
The goal of the profiling is to look for code bottlenecks where the most time is spent. (Well, desktop profilers can deliver more info, but this is the main reason anyway.)
At the time of this writing there exists only one WP7 profiler coming from Equatec. An easy, user-friendly tool that you will be able to use within minutes. The free version has a single limitation - it profiles a single assembly only.
The problem with Equatec profiler is that it will measure only your code.
In fact, it performs similar measurements as described above for all your methods. That's often useful, but it won't help if the bottleneck is slow UI/rendering, binding etc.
According to unofficial reports Microsoft is working on WP7 profiler that should be able to examine the time spent while rendering the visual tree. If so, we can look forward for another useful tool that might identify another part of performance problems.
Anyway, right now we have no other option, but to deeply understand what's going on in our WP7 application, how it interacts with SVL and .NET etc.
Analyzing visual tree
What you see as a single XAML object might in fact represent a complex structure. E.g. a TextBox control consists of three nested controls: Grid, Border and ContentControl. (With lots of bindings in place.)
Compare to the TextBlock, which has no internal structure at all!
Of course, with TextBlock you lose border, background, padding, but maybe you don't need these properties or you can implement them more efficiently.
Let's generalize: Study your visual tree carefully to identify possible simplifications.
To see the visual tree of your application you can use e.g. the TreeHelper class from Dave Relyea (http://dl.dropbox.com/u/254416/blog/TreeHelper.cs).
Some general layout-related rules:
- Do not nest lots of panels (multiple layout passes)
- Use simple constructs: canvases (instead of grids), fix sized items
- Collapsed element: no processing involved (but switching to Visible means complete recreate & redraw)
More performance tips
Keep in mind that most advanced technologies come at a cost. What was welcome on the desktop might cause serious slowdowns on the device.
While it is not the purpose of this article to collect all performance-related tips scattered over the web, here are at least some of them.
Things done more efficiently in code:
- Data binding, converters: If possible, replace them by special properties.
- Creating controls in code is faster than Xaml + binding.
- Visibility converters can be handled by code more efficiently.
Typical inefficient constructs:
- Unneeded background colors
- TextBlock with opacity = 0
- Non-rectangular clips, opacity masks
- Large textures ( > 2K pixels either dimension)
Rules applicable to animations:
- To run on GPU only animate simple properties - transforms and opacity.
- If the dependency property has a change handler, animating that property will be done on UI thread (slow).
- Bitmap caching means element is stored and used as bitmap after 1st render pass
- Hiding cached element by setting opacity=0 might be faster than element collapsing.
You will find other specialized tips on images, data/UI virtualization, ListBox, Popup, Pivot and Panorama controls etc.
Example - Optimizing MonthCalendar control
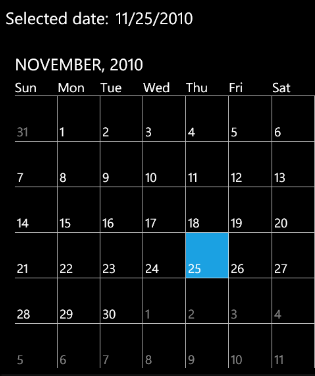
MonthCalendar (part of Resco MobileForms Toolkit, Windows Phone 7 Edition) is a rather advanced control that can be used for various purposes. Below you can see the date selector. (The TextBlock in the upper part does not belong to MonthCalendar control.)
 Here is another interesting example – MonthCalendar control used to select multiple dates. (Same UI is used when MonthCalendar presents a series of appointments.)
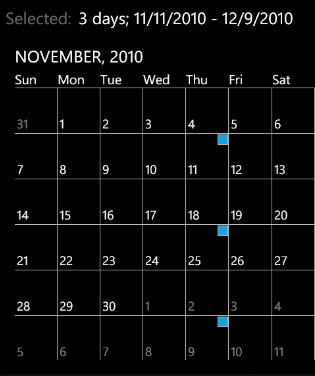 Summary: MonthCalendar displays scrollable calendar, single-selection and multi-selection ("blue dots").
MonthCalendar displays 6x7 matrix (a grid control), representing 6 weeks containing the current month.
To achieve fluent animations - the grid extends above and below the visible area. (3 pages altogether, i.e. 3x6x7=126 elements)
Each grid cell contains a ContentPresenter item that is mapped to a data object (MonthCalendarItem class) using this DataTemplate:
Summary: MonthCalendar displays scrollable calendar, single-selection and multi-selection ("blue dots").
MonthCalendar displays 6x7 matrix (a grid control), representing 6 weeks containing the current month.
To achieve fluent animations - the grid extends above and below the visible area. (3 pages altogether, i.e. 3x6x7=126 elements)
Each grid cell contains a ContentPresenter item that is mapped to a data object (MonthCalendarItem class) using this DataTemplate:
<DataTemplate x:Key="itemTemplate">
<Grid>
<!-- label -->
<Border Background="Transparent"
HorizontalAlignment="Stretch" VerticalAlignment="Stretch" Height="69" Padding="3" >
<TextBlock
FontSize="{StaticResource PhoneFontSizeSmall}"
Text="{Binding Label}"
Opacity="{Binding EnabledOpacity}"
HorizontalAlignment="Left" VerticalAlignment="Bottom" />
</Border>
<!-- Blue "dot" in the top right corner marking the days with a calendar event -->
<Border
Visibility="{Binding Path=HasValue, Converter={StaticResource VisConverter}}"
Background="{StaticResource PhoneAccentBrush}"
BorderThickness="1"
BorderBrush="{StaticResource PhoneBorderBrush}"
Width="16" Height="16" Margin="1"
HorizontalAlignment="Right" VerticalAlignment="Top" />
</Grid>
</DataTemplate>
As you see - each cell displays several indicators:
- The label (day number). Label opacity is decreased if the label does not belong to the current month.
- Optional calendar event ("blue dot")
- Selection (changed background)
The problem
The 126 ContentPresenter's are created when the MonthCalendar is loaded. This appears to be a slow operation.
The scrolling is implemented efficiently - existing ContentPresenter's are remapped to other data items.
What follows is the brief description of the steps we took to optimize MonthCalendar performance. At the end the control loaded 5x faster. (Well, if we take into account that the test page used to host the MonthCalendar needed 60 msec to load itself, the gain was even larger.)
1. Original state - 2145 msec
We measured the time elapsed between the MonthCalendar constructor and Loaded event.
(Measured on a device, the number is an average of several trials. To reduce the fluctuations GC.Collect() was called before each measurement.)
2. Visibility converter removal - 1903 msec
We removed the converter for the "blue dots" and manipulated the visibility directly in the code.
3. DataTemplate removal - 1115 msec
We created the UI element in the code: It became a Grid instance with all sub-elements created manually.
The savings:
- ContentPresenter layer was excluded (simpler visual tree)
- DataTemplate processing omitted
4. Bindings removal - 772 msec
All three bindings were replaced by direct code manipulation.
5. Optimizing the header - 699 msec
Without explaining the details, let us just say that this was the result of the simplification of the table header visual tree.
6. Indicators created on demand - 510 msec
We'll skip the details here. Let us just say that seldom used sub-controls (such as the "blue dot") were not created at load time but when they were used for the first time.
7. Algorithm change - using only 3 day rows above/below visible area - 408 msec
The final optimization was based on the way the calendar works: Once it is scrolled 50% up or down - a new month is forced.
This means that we need only half-pages above and below, i.e. the item matrix reduced to 2x6x7 = 84 items.
Other optimizations that were not employed in the final version:
- Deriving MonthCalendarItem from Canvas instead of Grid - small savings.
(This optimization wasn't used finally as it required more code changes.)
- Setting CacheMode = new BitmapCache()
While it might help later (during the animation), it has negative impact on the loading.
Conclusion
After avoiding the use of several SVL core features (templating, binding, converters) we could optimize MonthCalendar to load more than 5x faster.
Let us add one a bit controversial remark: The source code of the MonthCalendar control became simpler.
Example - Indeterminate ProgressBar ("animating dots")
Another case we examined was a frequently used nice animation - five small dots running across the screen. Technically speaking it is ProgressBar control with IsIndeterminate property set to true.
Many of you might have noticed Jeff Wilcox's article warning against the use of standard ProgressBar (http://www.jeff.wilcox.name/2010/08/performanceprogressbar/) as it is based on animating five slider controls with terrible performance impact. The ProgressBar creators chose slider control as it is the only standard SVL control which can be animated over fixed interval (0-100%) and unknown width. (Unknown at the moment when the animation is defined.)
Instead, Jeff offered a more efficient alternative ProgressBar template (known under the name PerformanceProgressBar). Jeff's solution (based on updating animation range in SizeChanged handler) is widely recommended all over the web.
We chose two different scenarios for testing:
- A worker thread running at max speed that the handheld CPU allows. In this scenario the bottleneck is the handheld processor.
- Downloading large amount of data from a web service and storing it in a database. In this scenario the bottleneck is the slow http communication, less so database operations.
In both cases we tested different possibilities of progress presentation.
Brief description of the PerformanceProgressBar
The simplified control layout is as follows (5 small transparent rectangles):
<Grid><Border>
<Grid>
<Rectangle Height="4" Width="4" x:Name="R1" Opacity="0" CacheMode="BitmapCache">
<Rectangle.RenderTransform>
<TranslateTransform x:Name="R1TT"/>
</Rectangle.RenderTransform>
</Rectangle>
// .... Identical definitions for rectangles R2..R5 (with transforms R2TT..R5TT)
</Grid>
</Border></Grid>
The simplified animation used:
<Storyboard RepeatBehavior="Forever" Duration="00:00:04.4">
<DoubleAnimationUsingKeyFrames BeginTime="00:00:00.0"
Storyboard.TargetProperty="X" Storyboard.TargetName="R1TT">
<LinearDoubleKeyFrame KeyTime="00:00:00.0" Value="0.1"/>
<EasingDoubleKeyFrame KeyTime="00:00:00.5" Value="33.1"/>
<LinearDoubleKeyFrame KeyTime="00:00:02.0" Value="66.1"/>
<EasingDoubleKeyFrame KeyTime="00:00:02.5" Value="100.1"/>
</DoubleAnimationUsingKeyFrames>
<DoubleAnimationUsingKeyFrames BeginTime="00:00:00.0"
Storyboard.TargetProperty="Opacity" Storyboard.TargetName="R1">
<DiscreteDoubleKeyFrame KeyTime="0" Value="1"/>
<DiscreteDoubleKeyFrame KeyTime="00:00:02.5" Value="0"/>
</DoubleAnimationUsingKeyFrames>
// .... Identical animations for R2 (delayed by 0.2 sec) … R5 (delayed by 0.8 sec)
</Storyboard>
Basically each rectangle is displayed for 2.5 sec while moving left-to-right.
Second rectangle is delayed by 0.2 sec, 3rd by 0.4 sec etc. so that the whole movement takes 3.3 sec.
Then there is 1.1 sec pause and the whole cycle repeats.
Using indeterminate progress bar for heavy background computations
Test setup
We created simple test environment with ProgressBar and heavy computation running on the background thread.
To simulate full CPU load we used this class:
public class Worker
{
private Thread _thread = null;
private static int _count = 0;
private int _startTime;
private static bool _done = false;
public void StartStop()
{
if (_thread == null)
{
_count = 0;
_done = false;
_startTime = Environment.TickCount;
_thread = new Thread(DoThread);
_thread.Start();
}
else
{
_done = true;
_thread = null;
int dt = Environment.TickCount - _startTime;
Debug.WriteLine("\n{0} msec, Count/sec={2}\n", dt, (_count * 1000.0) / dt);
}
}
public static void DoThread()
{
while (!_done)
{
_count++;
int cnt = 100 + _count % 100; // a number with 3 digits
cnt.ToString();
}
}
}
Each time the thread was stopped we printed the value Count/sec which characterized the work done by the background thread. (Because of the fluctuations, each test was repeated several times.)
The XAML code defined a checkbox and a progress bar. The progress bar was set to the indeterminate state whenever the checkbox was checked.
<StackPanel Orientation="Horizontal">
<CheckBox x:Name="ProgressCheckBox" />
<ProgressBar Width="250"
IsIndeterminate="{Binding ElementName=ProgressCheckBox, Path=IsChecked}"
Visibility="{Binding ElementName=ProgressCheckBox, Path=IsChecked,
Converter={StaticResource BoolToVisibilityConverter}}" />
</StackPanel>
In the C# code we made sure that the worker thread was running while the checkbox was checked.
public partial class TestPage : PhoneApplicationPage
{
private Worker _worker;
public TestPage()
{
InitializeComponent();
ProgressCheckBox.Click += new RoutedEventHandler(ProgressCheckBox_Click);
_worker = new Worker();
}
void ProgressCheckBox_Click(object sender, RoutedEventArgs e)
{
bool? isChecked = ProgressCheckBox.IsChecked;
if (isChecked.HasValue)
_worker.StartStop();
}
}
Test cases and results
Except of the standard progress bar we also used Jeff Wilcox's template (packaged in the class PerformanceProgressBar - part of the Resco MobileForms Toolkit, Windows Phone 7 Edition).
The only change against the described test setup concerned the XAML file where we used:
<r:PerformanceProgressBar Width="250"
IsIndeterminate="{Binding ElementName=ProgressCheckBox, Path=IsChecked}"
Visibility="{Binding ElementName=ProgressCheckBox, Path=IsChecked,
Converter={StaticResource BoolToVisibilityConverter }}" />
Additionally, we tested modified PerformanceProgressBar with the Duration property set to 8.8 sec. (I.e. a longer pause between visible animations.)
Typical results are presented below (numbers are rounded, of course):
| Test case |
Count/sec |
| No progress bar |
435000 |
| Standard ProgressBar |
153000 |
| PerformanceProgressBar (4.4 sec) |
192000 |
| PerformanceProgressBar (8.8 sec) |
248000 |
We also tested other modifications of the PerformanceProgressBar such as:
- Animating 3 dots instead of 5
- Other simplifications of the animations performed such as excluding opacity changes or using AutoReverse etc.
Although we noted the improvements in performance counters (UI thread frame rate, for example), these changes did not bring any measurable effect for the background thread performance.
Apparently the work done in single animation step was smaller, but the background thread did not run faster. It looks like the animation engine tried to use up available computational resources. (One explanation could be that the thread responsible for animations runs at a higher priority and accommodates the gains from optimizations.)
Conclusion:
While the animations can be optimized, the safest bet in computationally heavy environment is not to use any animations at all.
Using indeterminate progress bar during web communication
Just a brief summary:
We used Resco CRM product where we tested various progress indicators during the download of complete customer data (SOAP protocol, 2000 customers).
Here are the typical numbers (approx. download duration):
| No progress messages at all |
50 sec |
| Standard ProgressBar, IsIndeterminate |
115 sec |
| PerformanceProgressBar, IsIndeterminate |
75 sec |
| Progress messages instead of progress bar |
55 sec |
Conclusion
- PerformanceProgressBar presents important improvement, but it still remains very inefficient.
- While it is often possible to optimize the layout of the animated objects, the main problem is the animation itself.
- Never use any animations to indicate the progress of heavy background computations.
About the Author
Jan Slodicka. Programming for over 30 years. Covered several desktop platforms and programming languages. Since 2003 working for Resco on mobile technologies – Palm OS, Windows Mobile, now Windows Phone 7.
You can contact me at jano at resco.net or through Resco forums.
Resco MobileForms Toolkit, Windows Phone 7 Edition can be downloaded from http://www.resco.net/developer/mobilelighttoolkit. The Toolkit contains a set of useful controls that simplify Windows Phone 7 programming. Besides WP7, there is also Windows Mobile, Android and iOS edition.
Resco is a company with a long tradition of mobile programming covering many platforms and both end-user applications and developer tools.