
Introduction
Do you have an existing On-Prem/Cloud environment in which you are running your enterprise application and want to use Application Insight to capture telemetry? With few simple steps, configure your server and get ready to start with Application Insights.
Click here to learn about Application Insights.
Click here for creating an Application Insight from Azure Management Portal.
Follow the below steps now:
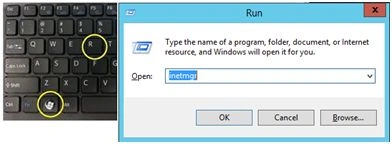
Step 1: Open IIS manager by pressing “Windows + R” button, type in “Inetmgr” and click OK.
Step 2: In IIS Manager, click on “Default Web Site” and “Content View” at the bottom to verify the files.

Step 3: To configure this server to use Application Insight, we would be installing the “Application Insights Status Monitor” on the server. Click on the link to download and install it.
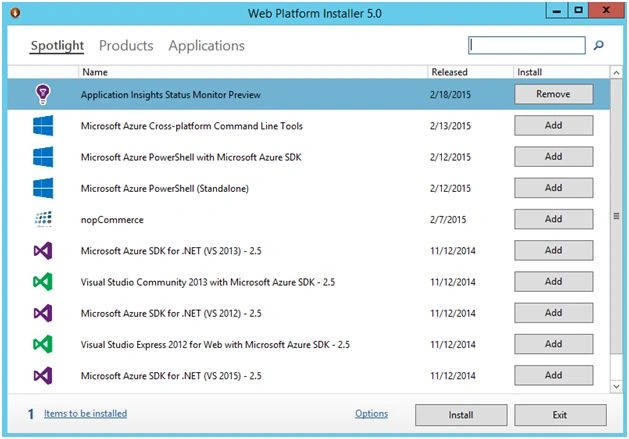
You can also install it from “Web Platform Installer”. Open the WebPI from Windows search by pressing “windows” button and just type “Web platform Installer”.

Step 4: In the WebPI window, type “Application Insights” in the server option. Select “Application Insights Status Monitor Preview”, click on “Add” and “Install”.
You can also install it from the local path we saved already.
“C:\AzureConference\HOL-ApplicationInsight\ApplicationInsightsAgent.msi”
After installing, launch the “Application Insights Status Monitor” and “Sign In” with the Azure account provided to you:
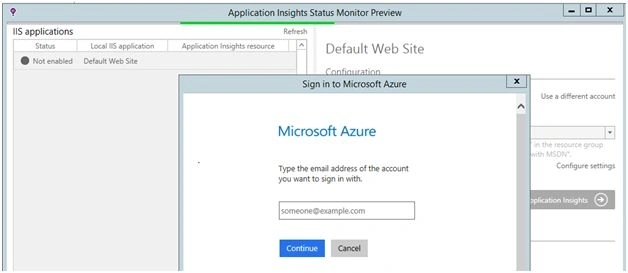
Step 5: After signing in, the “Application Insights Status Monitor” will show the list of Application Insight Resources. Select the resource you created in Lab-1 and click the button “Add Application Insights”:

It will take a few seconds to configure the website to use “Application Insights” and will show a prompt in order to restart IIS:

After restarting IIS, the website status will turn to “Enabled” and it will start logging telemetry data to “Application Insights”.
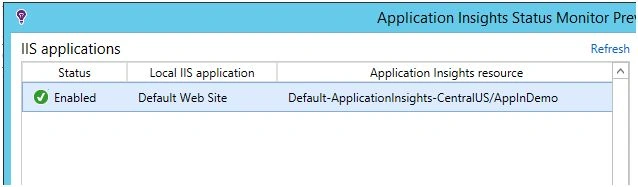
The Application Insights Status Monitor agent places a “ApplicationInsights.config” configuration file under your website directory and adds some configuration settings in Web.config file:

Step 6: Now, browse the following URL in browse tabs to start logging some telemetry data:
http://localhost/default.aspx
http://localhost/pingtest.aspx
Now, switch to “Application Insight status monitor” and click on “Open in Microsoft Azure Portal”.
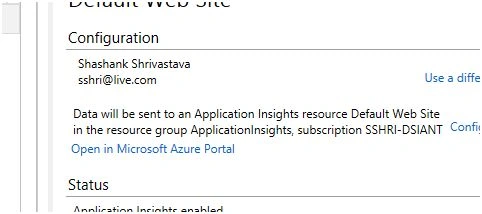
Step 7: Login to the portal and it will open the Application Insights resource in which we are logging the server’s telemetry data:
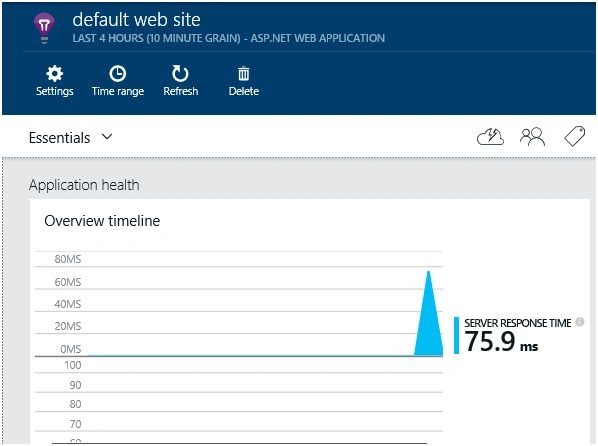
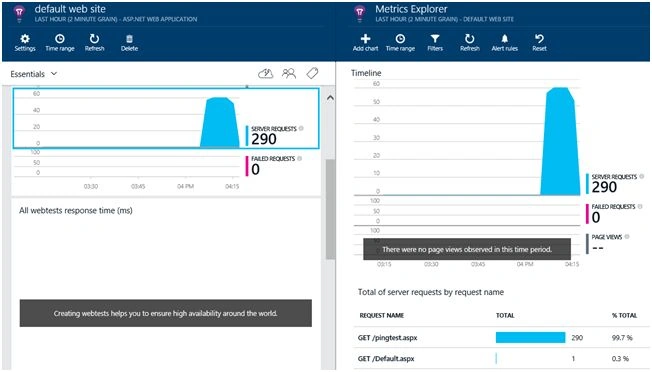
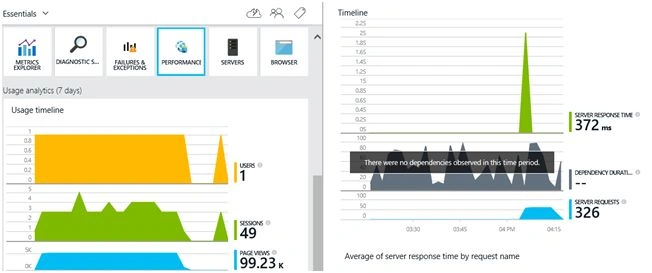
Summary
This Application Insight will help you to track the performance and usage of the Web Application that has been hosted on Microsoft Azure Service. You can also track adoption and usage with the pages, events, and metrics.
We will be working with Application Insights and attaching it towards existing ASP.NET Web applications in future posts.

Configure an IIS Server To Use Application Insight
Join the conversation! Your thoughts help the community grow.
Sign in to leave a comment
It is the same account you read, post and publish with — and you will come straight back to this page.
shashank shrivastavaPosted Apr 3, 2018, 7:06 AM
Reproducing images from other sources is not a good practice without mentioning it or giving due credit in your blog. Also its a good practice to mask the emalids and other data if you are copying it from there training content you procured from somewhere and not self created. I found the same blog on https://social.technet.microsoft.com/wiki/contents/articles/34449.iis-application-insight-integration.aspx too.
Ricardo MagalhaesPosted Jun 13, 2017, 5:42 AM
Thank you! Very good article!
Sonu ChaudharyPosted Jun 6, 2016, 9:57 AM
good one...
Vignesh ManiPosted Jun 1, 2016, 12:43 PM
Nice
Debasis SahaPosted Jun 1, 2016, 1:45 AM
Nice share..
Praveen SreeramPosted May 31, 2016, 8:52 PM
Nice. Are there any alternatives to use application insights? I have two concerns here 1) it might not be possible to install softwares in production environment 2) restarting IISServer would pull all the sites down at least for a minutes or two. It would be great if you can suggest alternatives of leveraging these App Insights :-)