

Introduction
In this article, you will learn how to use SQL Profiler and Database Tuning Advisor to improve the performance of a database.
What is SQL Server Profiler?
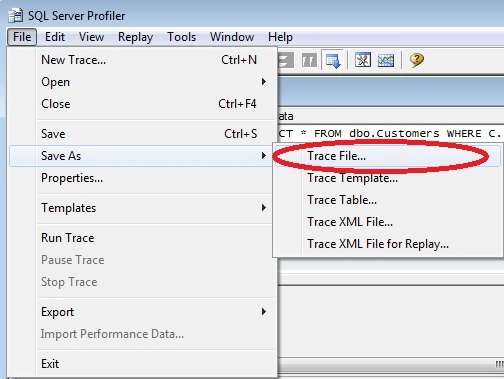
Microsoft SQL Server Profiler is a graphical user interface to SQL Trace for monitoring an instance of the Database Engine or Analysis Services. You can capture and save data about each event to a file or table to analyze later. For example, you can monitor a production environment to see which Stored Procedures are affecting performance by executing too slowly.
What is Tuning Advisor?
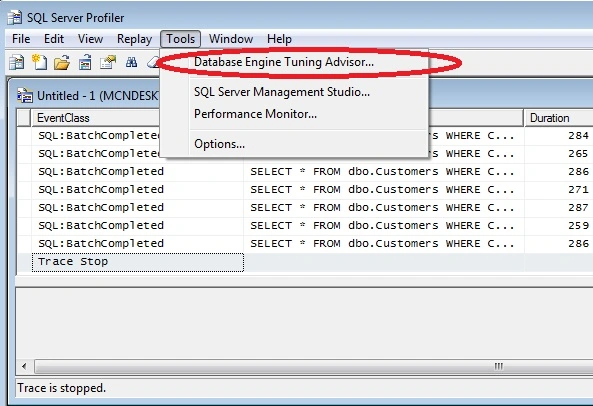
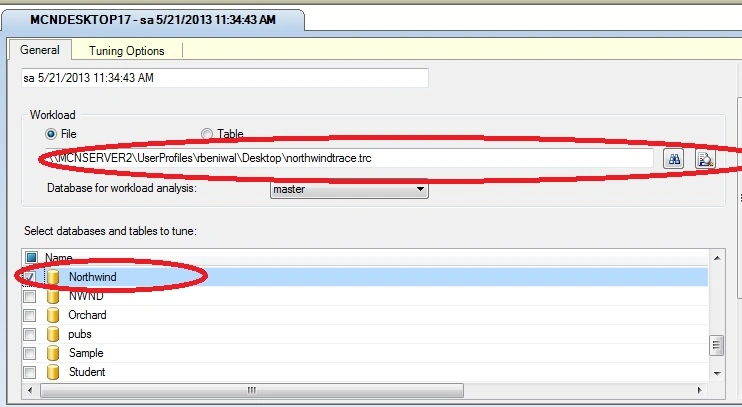
The tuning advisor helps to get the performance report that is generated by SQL Profiler and provides the appropriate indexing. It takes one or more SQL statements as input and invokes the Automatic Tuning Optimizer to perform SQL tuning on the statements.
Real-Time Example
The following is a real-time example
- First of all start SQL Server 2008
- Click on New Query
- Select Northwind database
Let's fire some select statements.
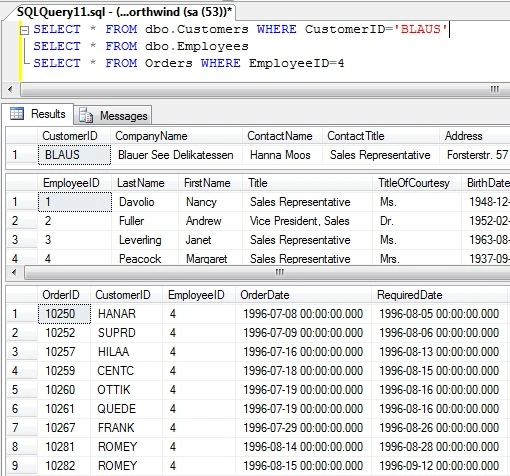
Image 1.
Those queries return three tables of data, the first table has 1 record, the second has 9 records and the third has 166 records.
Now let's start SQL Profiler, go to the tools.
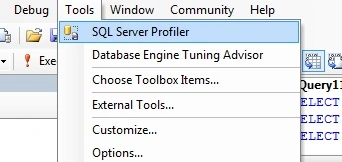
Image 2.
And provide the login credentials to connect.
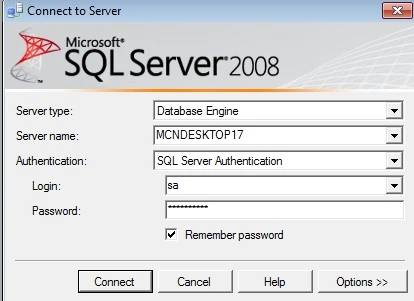
Image 3.
You will see it shows the trace properties, like name, provider name, and provider type.
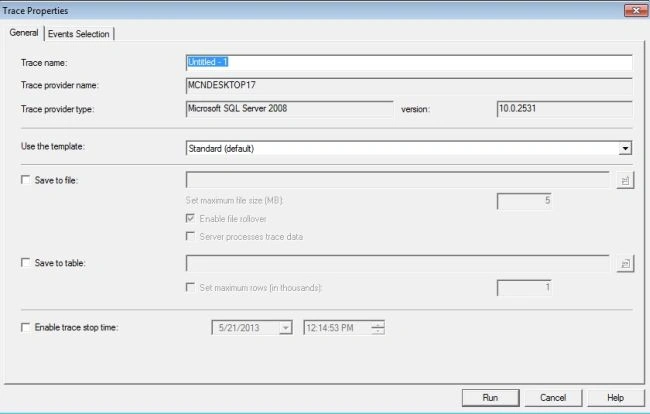
Image 4.
Now click on the "Run" button.
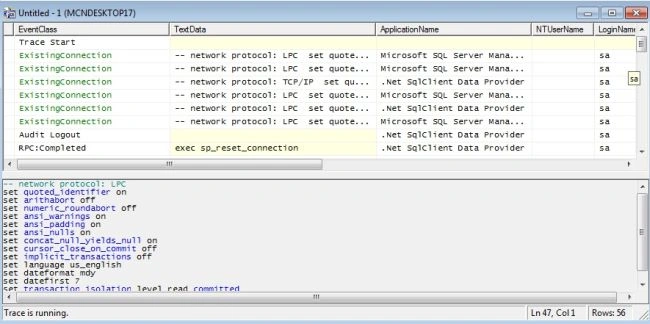
Image 5.
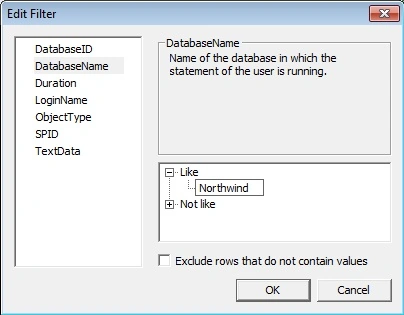
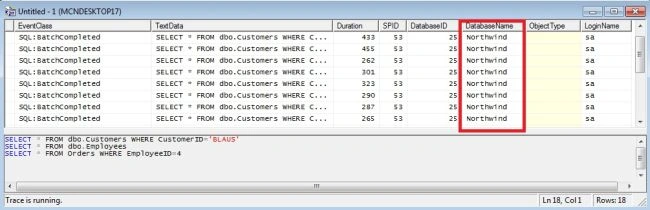
You will see that there are many queries running internally but we want only the Northwind report. Let's make some changes to the trace properties.
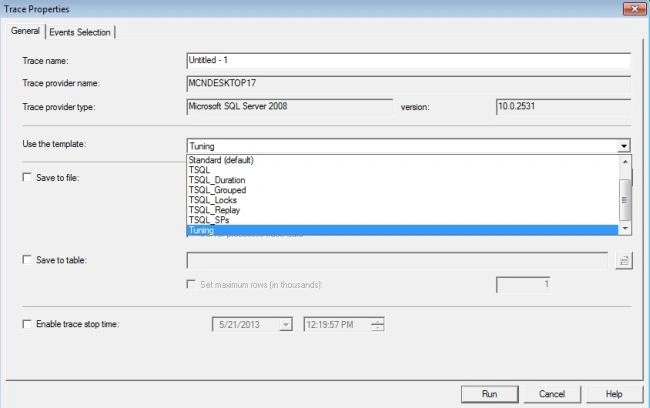
Image 6.
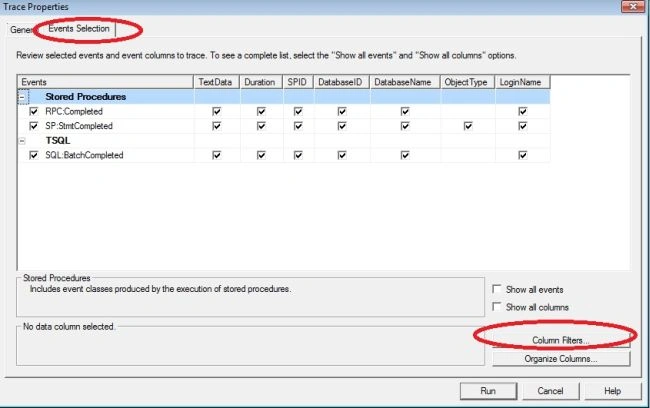
Since we are creating this for tuning purposes, select the template for tuning and select the event selection tab and click the "Column filters" button.
Dennis ThomasPosted Dec 21, 2017, 4:01 AM
Thank you for the article!
Manas MohapatraPosted May 26, 2015, 5:25 AM
Elegant article. Everything is properly described which helps a reader to understand. Thank you so much SIR !!!
alok donPosted Feb 12, 2015, 7:05 AM
Awesome Article and i understood today clearly :)