

Introduction
In a recent experience, mobile application planning, development, testing, and deployment were going well, as per the customer estimation, but after a while, the client was clamoring that the app was becoming slower and slower when it was continually being used. It reached the point where it would just crash suddenly but most of the developers were unaware why it’s like this. In this article, you are going to learn how to use prevent memory leak and profiler in a Xamarin Application.

Garbage Collection
We all know that in the .NET world, we have a very good friend called Garbage Collector. Basically, it is responsible on freeing up the used memory. As simple as it sounds, whether you are in a Desktop, Web or especially mobile where there are two worlds one is Managed and the other one is the native part which at times Garbage Collection is not enough to reclaim those used memories the cause of the slowdown Mobile app is due to Memory Leaks.

Beware of common memory leak sources
With incorrect memory management, an object is stored in memory but cannot be accessed by the running code, it’s always causing a memory leak in mobile application. We all know what we cannot do, but we are still doing things as in the below images. It's the same in Mobile Development also; we all know what can’t do, but still, we are making the same mistakes.

I suggest to be extra careful when using the below C# feature, and proactively check for memory leaks with techniques like the last best practice.
- Events, delegates or Messaging Centers in .NET are notorious for causing memory leaks. You can innocently subscribe to an event, causing a damaging memory leak without even suspecting.
- Custom control and Unknown Nuget package are event registered, such as Loaded, will not be unloaded until all events are unregistered. Always remember to unregister your events when you don't need them anymore and we are not sure all the objects or disposed.
- Images is a classical .net GC-Java GC problem when GC isn't aware of image size and won't release reference unless it is Disposed.
- Static variables, collections, and static events in-particular should always look suspicious. Remember that all static variables are GC Roots, so they are never collected by the GC.
- Caching functionality in mobile apps is necessary, any type of caching mechanism can easily cause memory leaks. By storing cache information in-memory, eventually, it will fill up and cause an OutOfMemory exception.
- Bindings can be dangerous. The rule of thumb is to always bind to a DependencyObject or to a INotifyPropertyChanged object. When you fail to do so, Xamarin will create a strong reference to your binding source (meaning the ViewModel) from a static variable, causing a memory leak
- Threads that never terminate – The Live Stack of each of your threads is considered a GC Root. This means that until a thread terminates, any references from its variables on the Stack will not be collected by the GC. This includes Timers as well. If your Timer’s Tick Handler is a method, then the method’s object is considered referenced and will not be collected.
Preventing Memory Leaks
Enterprise Mobile application knows memory leaks are like overloaded people on a bus or train. You might not notice when there are few of them, but you always make sure people enter in the bus with very limited and identify bus capacity based on that you need to allow the people into the bus. In a mobile application, you should define to the developer with a strike rule and a 'TO DO' list and make sure your code review has taken care of the following options to prevent memory leaks.

Using Statement
Xamairn Mobile application constantly uses unmanaged resources. The .NET framework itself relies heavily on unmanaged code for internal operations, optimization. Anytime you use Streams, Graphics, or Files, for example, you are probably executing unmanaged code. The using statement transforms the code into a try / finally statement behind the scenes, where the Dispose method is called in the finally clause.
- public void CreateFile()
- {
- using (var stream = new FileStream(@"\Document\SomeFile.txt",
- FileMode.OpenOrCreate))
- {
- // do stuff
- }// stream.Dispose() will be called even if an exception occurs
Dispose pattern
You implement a Dispose method to release unmanaged resources used by your application. The .NET garbage collector does not allocate or release unmanaged memory. The Dispose method performs an object clean up, so the garbage collector no longer needs to call the objects' Object. Finalize override. Learn more at the MSDN portal.
- public void Dispose()
- {
- // Dispose of unmanaged resources.
- Dispose(true);
- // Suppress finalization.
- GC.SuppressFinalize(this);
- }
Test for memory leaks
It’s a great practice to proactively test for memory leaks. And it’s not that hard. Here’s a short pattern you can use in the unit testing project.
- [Test]
- void MemoryLeakTest()
- {
- var weakRef = new WeakReference(leakyObject)
- // Ryn an operation with leakyObject
- GC.Collect();
- GC.WaitForPendingFinalizers();
- GC.Collect();
- Assert.IsFalse(weakRef.IsAlive);
- }
Getting Started Profiling
The Xamarin Profiler is a great tool created by Microsoft, wherein it gives developers ways to profile or collect telemetry with your Mobile Applications using Visual Studio. It can also be paired with native profilers, like Xcode Instruments and Android Profiler, to ensure better app behavior and performance. The main function of the profiler is to collect and displays information about the Mobile App wherein the Developer can pinpoint, analyze and optimize areas in their application for a smooth experience by end-users. There are different ways the Xamarin Profiler can help, such as in the statistical realm.
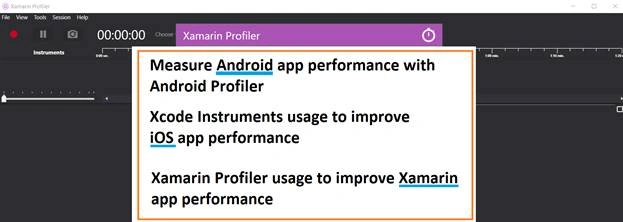
The Xamarin Profiler has many features Allocation, Cycles, Data presented on each screen and Time profiler. It’s a graphical interface for the Mono log profiler, and supports profiling for the following platforms in Windows and Mac machines.
- Android, iOS, tvOS, and Mac applications on Mac
- Android, iOS, and tvOS applications on Windows.
In this section, we will learn common profiling scenarios and analyze and optimize iOS and Android applications.
Prerequisites
We need Visual Studio Enterprise subscribers to unlock Profiler feature in either Visual Studio Enterprise on Windows or Visual Studio for Mac on a Mac. Download install the following package in your Mac or Windows machine.
After successful installation, let get start use Profiling in Xamarin iOS and android application. Integrate Profiling is very simple, you need a few changes in Project Property options in iOS and Android Project.
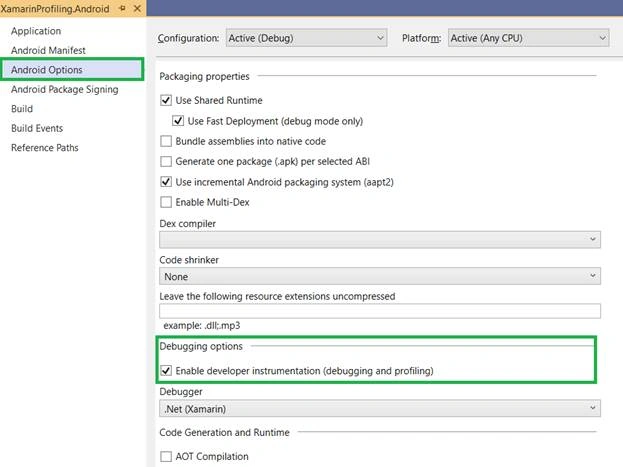
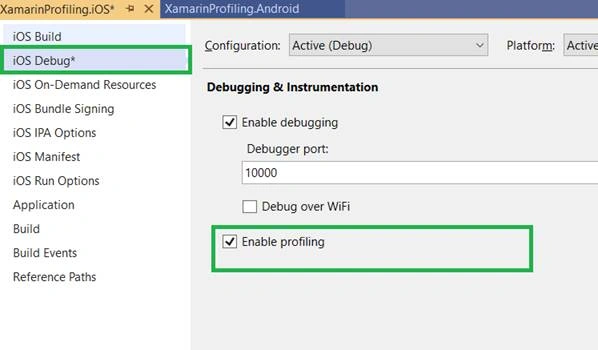
Create a new Xamarin Forms project using Visual Studio and Select iOS and Android platform is supported and follow below two steps for enabling the profiling in iOS and Android Project.
Android
In Android Project, Right click on project > Select property > Select “Android Options” > Select options “Enable developer instrumentation”.
iOS
In your iOS Project, right-click on Project > Select Property > Select “iOS Debug” Options and check the checkbox, “Enable Profiling”.
Start the Xamarin Profiler
Step 1
Build and run the application in iOS or Android.
Step 2
In Visual Studio menu, Select Analyze or Tools main menu > Select Xamarin Profiler and open the Profiler and make sure before open profiler, the application needs to be built at least once in order to start a profiling session.
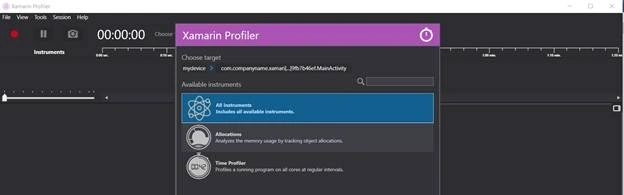
The Xamarin Profiler comes with following instruments,
- All Instruments
- Time Profiler.
Once you have selected the Allocations options you can also configure some options of how the memory profiling will proceed. You can either customize the frames, frequency or either select from the presets as shown in the below image.
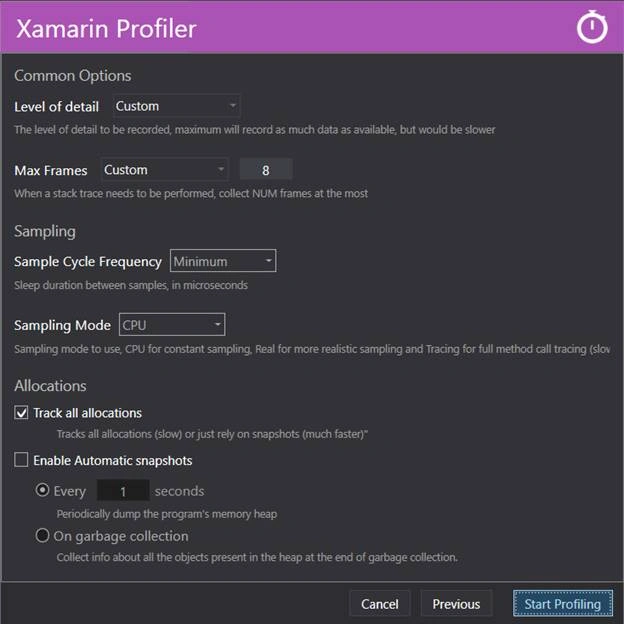
Once you have clicked the Start Profiling button it will automatically launch your selected application on the selected device and you will be greeted with this window.
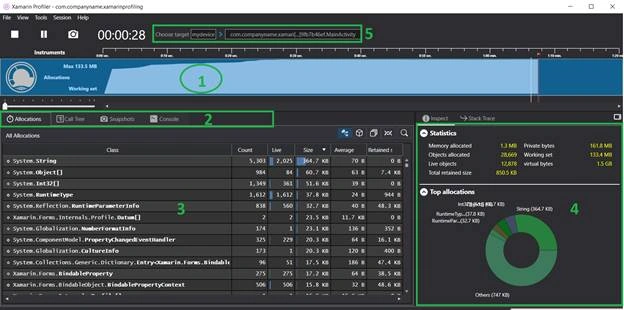
In that above image denoted number with green marked and detail info below
- No 1 - Represents the actual graph of the Memory consumption with respect to time.
- No 2 - Represents the different data categorized on your selected tab.
- No 3 -Represents the information (Object name, count, size) displayed based on the selected tab.
- No 4 - Represent the real-time display of information based on the current snapshot.
- No 5 - Represents the Selected device and the Application that is currently running.
Snapshots
Snapshots pane displays information about memory snapshots. To generate these while profiling a live application, click the Camera button in the toolbar at each point that you'd like to see what memory is retained and released. You can then click each snapshot to explore what is happening under the hood. Note that snapshots can only be taken when live profiling an app.
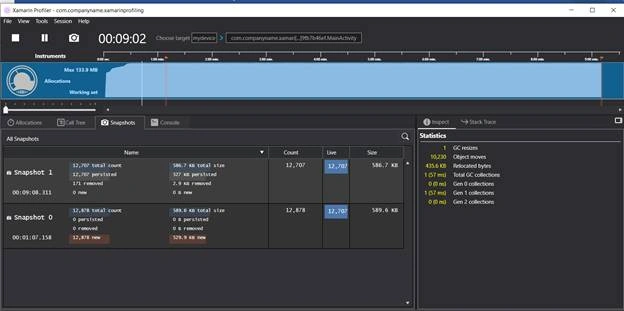
Time Profiler
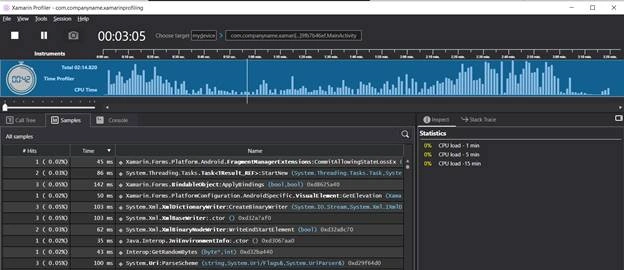
The Time Profiler instrument measures exactly how much time is spent in each method of an application. The application is paused at regular intervals and a stack trace is run on each active thread. And Call Tree options will show the amount of time spent in each method.
I hope you enjoyed learning to profile and prevent the memory leak issue. Let me say that profilers are not only for memory leaks, but also can be used in code optimization. Finally, moving forward maybe you can also adapt or put in your development routine the profiling of your mobile applications.
Summary
I hope this article gave you some value, let's make a New Year’s resolution of better memory management while doing C# programing. Please leave your feedback/query using the comments box, and if you like this article, please share it with your friends.
muralikrishnan vPosted Jun 22, 2021, 4:53 PM
The above unit test case always fails as the Android will do the GC collect on its own.
Tahir AlviPosted Feb 5, 2020, 5:55 AM
Honestly in article writer explain the C# code memory leaks not the Xamrin specific. Both suing statement and dispose class is used for unmanaged code.
devi rajuPosted Jan 10, 2020, 10:02 AM
Interesting one. Thank you... :-)
Vidyadharran GPosted Jan 10, 2020, 10:01 AM
Recently i got drifted to mobile application development from web development..this will be useful for me from starting itself ...thanks bro for sharing such a nice article :)
NimishaPosted Jan 10, 2020, 7:46 AM
It's very interesting, This should be very useful to all xamairn developers, while developing we are missing this. Thanks Sir for sharing :)