

In Azure Machine Learning Studio, we usually use two-class or multi-class classification decision jungle to predict future datapoint categories. If we want to take a decision between the two choices, using provided features, then we should use Two-class classification decision jungle to design our model. It solves classification problems and it can handle more than 100 k data points and the number of features must be less than 100. If our primary preference is speed of the system, then we should consider Two-Class Averaged Perception model but, if our preference is accuracy, then Two-Class decision jungle model is a preferable choice. If the dataset has overlapping features – the feature values and nature are similar, then we can also consider Two-class boosted decision tree model. Model selection solely depends on the problem, dataset, features and our priorities.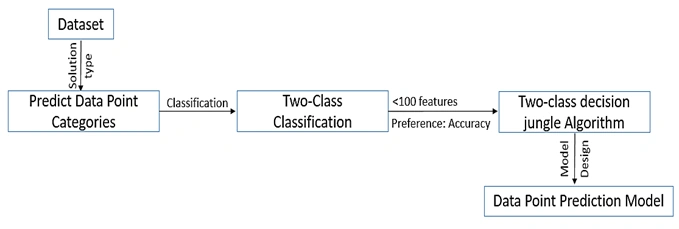
Figure: Two-class decision jungle model architecture in Azure ML Studio
Two-Class Decision Jungle Application in Azure ML
In this section, we will design a real life machine learning Application, using an open source Titanic Survival dataset to predict the survival of passengers according to the provided data.
Dataset Information
The sinking of the RMS Titanic is one of the most infamous shipwrecks in history. On April 15, 1912, during her maiden voyage, the Titanic sank after colliding with an iceberg, killing 1502 out of 2224 passengers and crew. This sensational tragedy shocked the international community and led to the better safety regulations for the ships.
We are going use the Titanic passenger dataset and their information to design our Machine Learning model and test the designed model to see whether it can accurately find out; whether a passenger will survive or not from the previous provided data.
This dataset is publicly available for the research purpose. Anyone can download the dataset from here and design Machine Learning model to predict Titanic survival rate.
Dataset link - https://www.kaggle.com/c/titanic#description
Download the dataset in CSV format, open Azure Machine Learning Studio and click New option from the left-bottom corner. Now, select dataset and click From Local File. Select the downloaded CSV file from local machine, name it and provide any optional description. Dataset type should automatically appear in the drop down list. Now, click right button to upload the dataset.
Now, again click New option from the left-bottom corner. Select Experiment and create Blank Experiment. Now, a blank experiment page should open in an Azure Machine Learning Studio, search titanic.csv file from the search bar on the top left corner. Drag and drop the dataset at the middle of the page. Right click on the dataset and select visualize to see the dataset from Azure ML Studio.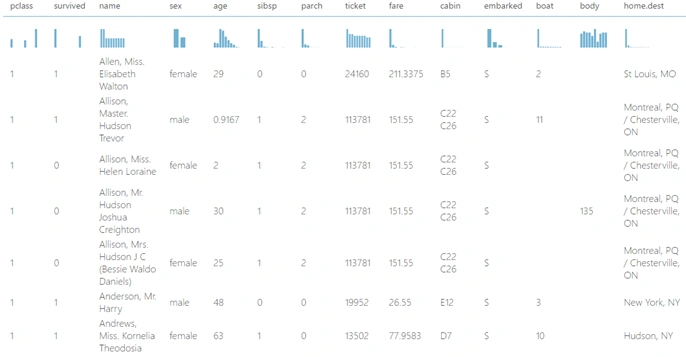
Figure: Titanic survival data set in Azure ML Studio
Data Aggregation
This dataset has 1309 rows and 14 columns of the passenger information. Out of 1309 passengers, 809 of them didn’t survive and 500 of them survived. Here, the survival percentage is 38% data and non-survival rate is comprising 62% of the data. Each row represents different information for each passenger.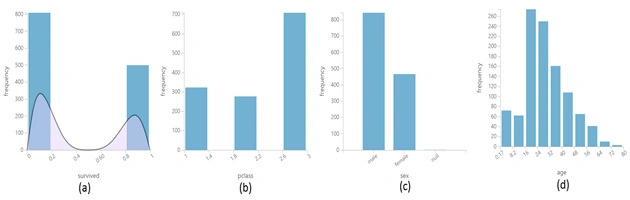
Figure: Data aggregation of data set, (a) survival frequency, (b) ticket class, (c) passenger sex classification, (d) passenger age classification pivot graph
Figure 5 depicts the aggregation of the data, where from (a), we can see 62% of the passengers didn’t survive and 38% of them survived. (b), passengers were divided into three classes, 54% of passengers belong to class 3, 21% belong to class 2 and 25% belong to class 1. (c), Most number of passengers of this ship were Male, which is 64% of total passengers and 36% were female. (d), from the age distribution Pivot graph of passengers, there were passengers from age 0.17 to 80 on that ship but 50% of the passengers belongs to 16 to 32 years old age group.
Machine Learning Model Designing
We are going to design one Machine Learning model, using a two-class classification decision jungle to find out, who survives and who doesn’t. It’s a two class problem since we are only determining whether a passenger survives or not. Here in this model, we will process the data, clean our data, split our data in train module and testing module, cross validate the train data, use two-class decision jungle as classifier and score the trained model and test the module and at the end evaluate the overall performance of the model.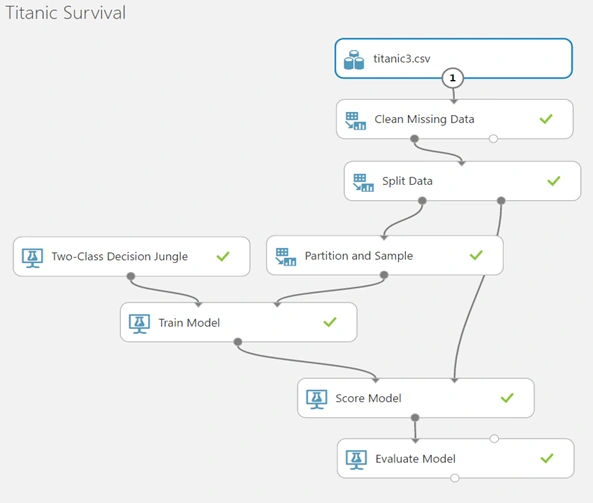
Figure: Azure Machine Learning Diagram of Titanic Survival Predictive Analysis
Azure Machine Learning Model Components
Titanic survival predictive analysis Machine Learning model has eight blocks (Figure -6). With the accuracy of 81.7%, it can detect if a passenger survives or not. Drag and drop each component, connect them according to Figure 6, change the values of Split data component, trained model and two-class classifier. Save the model and run it.
- Dataset
We are using titanice.csv as the dataset of Machine Learning model. This dataset has 1310 rows and 14 columns of Titanic ship passenger information.
- Clean Missing Data
Clean missing data component is used to eliminate missing and garbage data from the system.
- Splitting Data
Splitting the data in two. First one is for training and second one is for testing purposes. Click Split data component and write 0.70 as the fraction of rows in the first output dataset. We are using 70% of our total data as training data, which is 917 passengers' information and 30% of the data as testing the data, which is 393 passengers' information. This is important because we want to create a model that guesses survival rate and then test it against some data, which was not used to generate the model. With such a small data set, how we split the data is important.
- Partition and Sample
Partition and sample is important to cross validate the data and make the model robust and reliable. Select Assign to Folds as the Partition or sample mode while 10 specifies the number of Folds to split evenly. We are using 10 Fold cross validation to validate the training data.
- Two-Class Decision Jungle
Two-Class classification decision jungle is a classification model, which we are using to classify the data. Here, the selected number of decision DAG’s are 8. Maximum depth of the decision DAG's is 32 and the width is 128. Number of optimization steps per decision DAG layer is 2048. As we have already determined that survival column is our output parameter, we select Single Parameter as the trainer mode. If we were not sure about the best parameter, then we should select Multiple Parameter.
- Train Model
Train model classifies the 70% training data, using the untrained Two-Class decision jungle module and returns one trained model , which also represents ILearnDotNet class. Click Trained model component and select a column from the launch column selector. This column will be used as the output column of Machine Learning system.
- Score Model
Score model takes an input from Trained model and 30% testing dataset and returns scored dataset of the problem. It calculates the score of the trained system with respect to the test dataset.
- Evaluate Model
Evaluation model is taking an input of Scored dataset from Score model and is giving us the evaluation resultS. Select Evaluate model, right click on it and select Visualize. Azure Machine Learning Studio will show the detailed result of the Machine Learning system.
Model Prediction Analysis and Accuracy Calculation
To analyze the performance of the model, there are so many parameters visible like True Positive, False positive, true negative, false negative, Accuracy of algorithm, precision, recall, f1 score, lift, ROC graph, AUC – Area under cover, throughput. When you do not have an algorithm knowledge, you should compare various parameters algorithm-wise and decide the final algorithm to train your model in classification example.
True positive: Survived passenger correctly identified.
False positive: Non-Survived passenger incorrectly identified as survived.
True negative: Non-Survived passenger correctly identified.
False negative: Survived passenger incorrectly identified as Non-Survived.
In general, Positive = identified and negative = not identified.
From Designed model, 393 passenger information were used to test the system,
True Positive: 139, False Negative: 5, False Positive: 67, True Negative: 182. Total: 393 passengers.
Accuracy rate is, 0.817 or, 81.7%, AUC (Area under Curve) value is, 88.2% and, Threshold value is 0.38.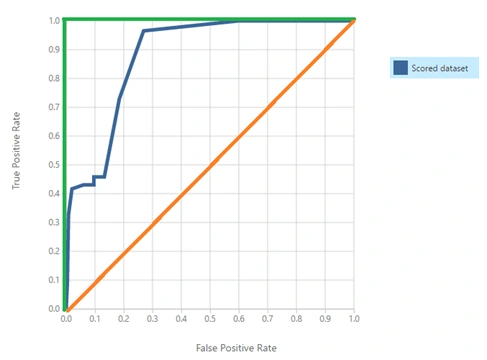
Figure: ROC Curve of the problem
The way to read this chart is to say for every probability of survival what percentage actually survived. From figure 7, we can see that the best possible model is represented by Green line and a totally random pick is represented by Orange line. We can also have a really bad model, where the graph will show Blue line in bottom or top right. The way to compare these models is by looking at the Area under the Curve, which will be somewhere between 0 (the worst) and 1 (the best). Our model is reasonably good and is given an AUC score of 0.882 or 88.2%. You need to set threshold value as well to get the maximum amount of accuracy. Here, we have used 0.38 as threshold value. Threshold value helps us to identify the class from the scored probabilities.
Conclusion
Two-class classifier algorithms are useful to solve and predict two-class classification problems. If our primary concern is accuracy and if we want to avoid overfitting problem, then two-class decision jungle is a Google model to design Machine Learning system, where it shows high accuracy and decent run time.
asma alniyadiPosted Dec 8, 2018, 11:54 AM
Please can you contact to me?? I need some help