

Introduction
Streamlit is an open-source Python library that has become a game-changer in data science and machine learning. It allows you to create user-friendly web applications directly from your Python code, eliminating the need for separate front-end development. This makes it accessible to both developers and non-programmers, enabling anyone to build interactive data experiences.
Key Features and Widgets
Streamlit offers a variety of built-in widgets to create interactive elements within your app.
- Text: Display information, titles, and explanations using st.write().
- Data Visualization: Use popular libraries like Matplotlib and Plotly to create charts and graphs, and then embed them with st.pyplot() or st.plotly_chart().
- Input Controls: Allow users to interact and modify parameters through elements like sliders, dropdown menus, and text boxes using st.slider(), st.selectbox(), and st.text_input().
- Buttons: Trigger specific actions within the app with st.button().
- Containers: Organize your app's layout with various containers like columns and tabs using st.columns() and st.tabs().
Example: Exploring Stock Prices
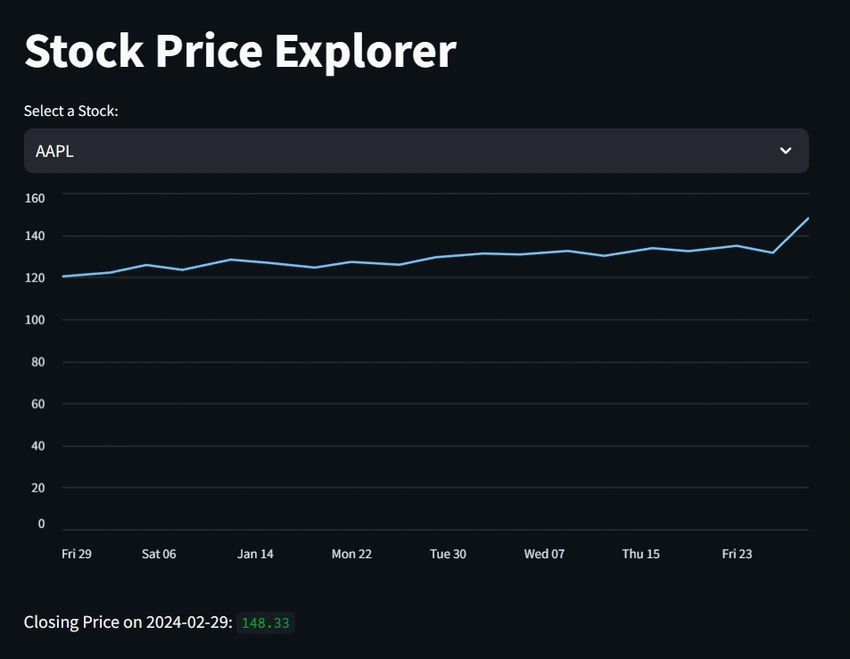
Let's create a simple Streamlit app to explore historical stock prices. We'll use the pandas library to load the data and Streamlit widgets to allow users to choose a specific stock and visualize its price movement.
import pandas as pd
import streamlit as st

# Load stock price data
data = pd.read_csv("stock_prices.csv", index_col="Date", parse_dates=True)

# Title and user input
st.title("Stock Price Explorer")
selected_stock = st.selectbox("Select a Stock:", data.columns)

# Filter data and display chart
filtered_data = data[selected_stock]
st.line_chart(filtered_data)

# Display closing price information
st.write(f"Closing Price on {filtered_data.index[-1].strftime('%Y-%m-%d')}:", filtered_data.iloc[-1])
This code snippet demonstrates how to use Streamlit widgets to create an interactive app.
- The st.selectbox() allows users to choose a stock from the available options.
- The st.line_chart() displays the price history of the selected stock.
- The app dynamically updates the displayed information based on user selection.
Benefits and Use Cases
Streamlit's ease of use and versatility make it suitable for various applications.
- Data Exploration and Visualization: Create interactive dashboards to explore and analyze data sets, allowing users to filter, zoom, and manipulate visualizations in real-time.
- Machine Learning Model Deployment: Develop web interfaces for trained models, enabling users to make predictions and interact with the model in a user-friendly manner.
- Data Science Prototyping: Quickly prototype data analysis workflows and share them with collaborators for feedback and iteration.
- Educational Tools: Build interactive tutorials and demonstrations to explain complex concepts and algorithms in a more engaging way.
- Internal Applications: Streamline internal workflows by creating custom applications for data processing, task management, or reporting.
Beyond the Basics
While Streamlit provides a low-code environment, it offers extensive customization options for experienced developers. By integrating with other Python libraries and frameworks, you can create more sophisticated functionalities.
- API Integration: Connect to external APIs to retrieve and display real-time data, expanding the reach and capabilities of the application.
- Machine Learning Integration: Embed trained machine learning models within the app, enabling users to interact with the model and observe its predictions.
- Deployment Options: Deploy Streamlit apps to various platforms, including cloud services and dedicated servers, for wider accessibility and collaboration.
Conclusion
Streamlit empowers users of all skill levels to create informative and interactive data applications. Its user-friendly interface, rich set of features, and ease of deployment make it a valuable tool for anyone who wants to share data and analysis in an engaging and interactive way.
Join the conversation! Your thoughts help the community grow.