
Introduction
Application Insights allow developers to report logs, performance metrics, request logs, generate application maps of a software system, and much more. The main purpose is to keep track of the software system and monitor its activity and performance. Application Insights allow the developers to create their own custom tiles for the dashboard.
Problem Statement
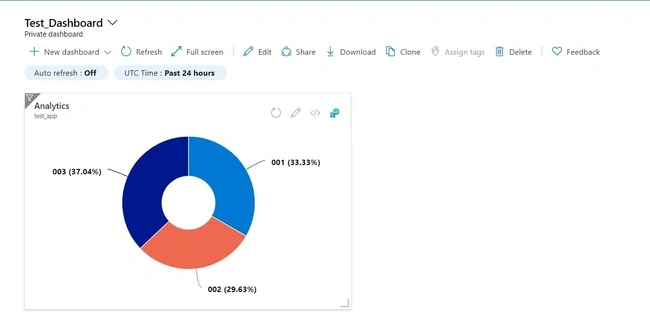
We have an Azure Function (Http Trigger) that takes a number as a query from URL and reports "001" if the number is odd, "002" if the number is even, and "003" if the number is prime. It's reported to Azure Application Insights as a trace. We have to make a tile for the dashboard that displays how many times each of the code was reported in a day and display it as a chart.
Solution
Develop a custom tile using a custom query in Kusto in Application Insights Logs, and pin the tile to the dashboard.
Prerequisites
- Microsoft Azure Subscription
- Application Insights resource deployed on Azure Portal
- Visual Studio 2019
- Azure SDK for Visual Studio
- .NET Core
- Postman for testing
Obtaining Instrumentation Key From Application Insights
Once the Application Insights resource is deployed on the Azure portal. Go to your Application Insights resource dashboard and retrieve the instrumentation key as shown below.

Developing an Azure Function
Installing Microsoft.ApplicationInsights Package
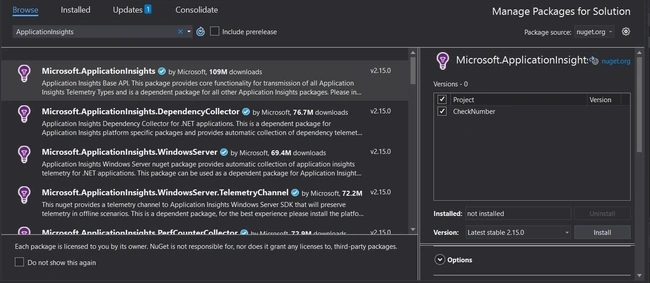
In order to use application insights, you have to install Microsoft.ApplicationInsights from NuGet package manager in Visual Studio.
Function Code
Open Visual Studio and develop the Azure Function with an Http Trigger, as shown in the code below:
- using System;
- using System.IO;
- using System.Threading.Tasks;
- using Microsoft.AspNetCore.Mvc;
- using Microsoft.Azure.WebJobs;
- using Microsoft.Azure.WebJobs.Extensions.Http;
- using Microsoft.AspNetCore.Http;
- using Microsoft.Extensions.Logging;
- using Newtonsoft.Json;
- using Microsoft.ApplicationInsights;
- using Microsoft.ApplicationInsights.Extensibility;
- namespace CheckNumber
- {
- public static class CheckNumber
- {
- // Create TelemetryClient object
- private static TelemetryClient telemetryClient = new TelemetryClient(new TelemetryConfiguration("INSTRUMENTATION_KEY"));
- [FunctionName("CheckNumber")]
- public static async Task<IActionResult> Run(
- [HttpTrigger(AuthorizationLevel.Function, "get", Route = null)] HttpRequest req,
- ILogger log)
- {
- // Getting number query from request
- string number = req.Query["number"];
- string code;
- // Converting number to integer
- int num = Convert.ToInt32(number);
- // Check if the number is prime
- if (isPrime(num))
- {
- code = "003";
- }
- // Check if the number is even
- else if (num % 2 == 0)
- {
- code = "002";
- }
- // Else number is odd
- else
- {
- code = "001";
- }
- // Report the code to Application Insights as Trace
- telemetryClient.TrackTrace(code);
- // Also return it
- return new OkObjectResult(code);
- }
- private static bool isPrime(int num)
- {
- int n1 = num / 2;
- for (int x = 2; x <= n1; x++)
- {
- if (num % x == 0)
- {
- return false;
- }
- }
- return true;
- }
- }
- }
Running and Testing the Function
Run the function.

Open up postman and test the function as shown in the picture below.

Test it multiple times with different numbers so the function can report logs to Application Insights.
Creating a Custom Tile
Go to your Application Insights resource deployed on Azure Portal. In the left panel, under Monitoring click on Logs and it will open a window on the right where you can write your custom queries in Kusto.
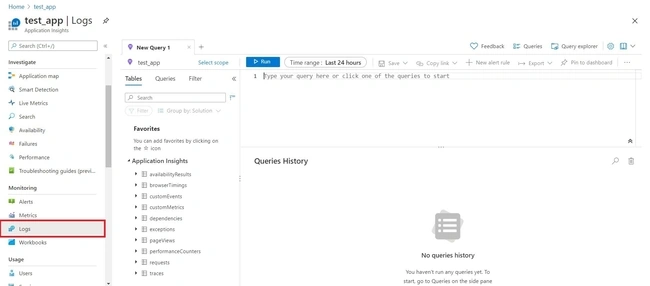
Now write the following query in the panel and click on Run.
- traces
- | summarize count() by message
Now you can view the results, click on Charts and select the chart you want.
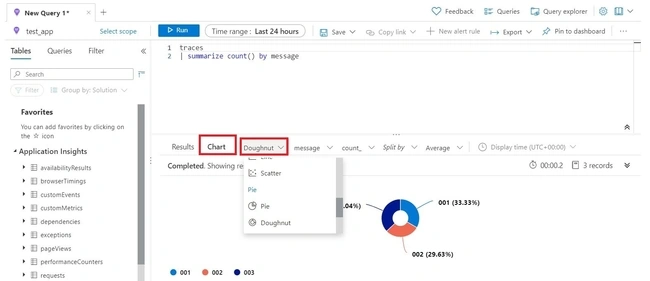
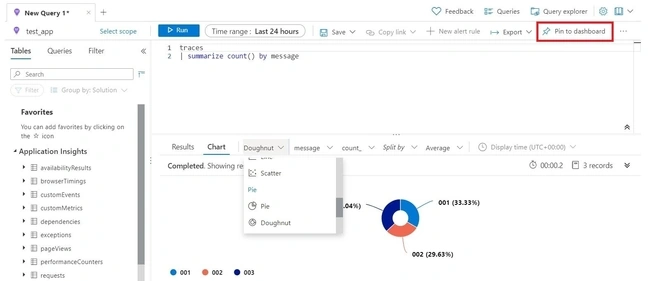
The next step is to pin the chart results to the dashboard, just click on Pin to dashboard and select the dashboard you want to pin it to.
View Tile in Dashboard
Go to your dashboard where you had pinned the tile and you can view it there, it will always show the latest results.
Conclusion
You can create any tile you want for anything. In this case, we have used simple Trace, but one can use Requests, Availability, Exceptions, and much more. You can write even more complex queries with Kusto and generate better charts and tiles, such as using unions and joins, etc. Many operations that can be done in SQL can be done by Kusto. For more information see the SQL to Kusto cheat sheat.
Stephen JhonPosted Nov 26, 2020, 8:49 AM
Really Helpfull