Code don't display the names of months in the Axis X
Hi there, hope in your help.
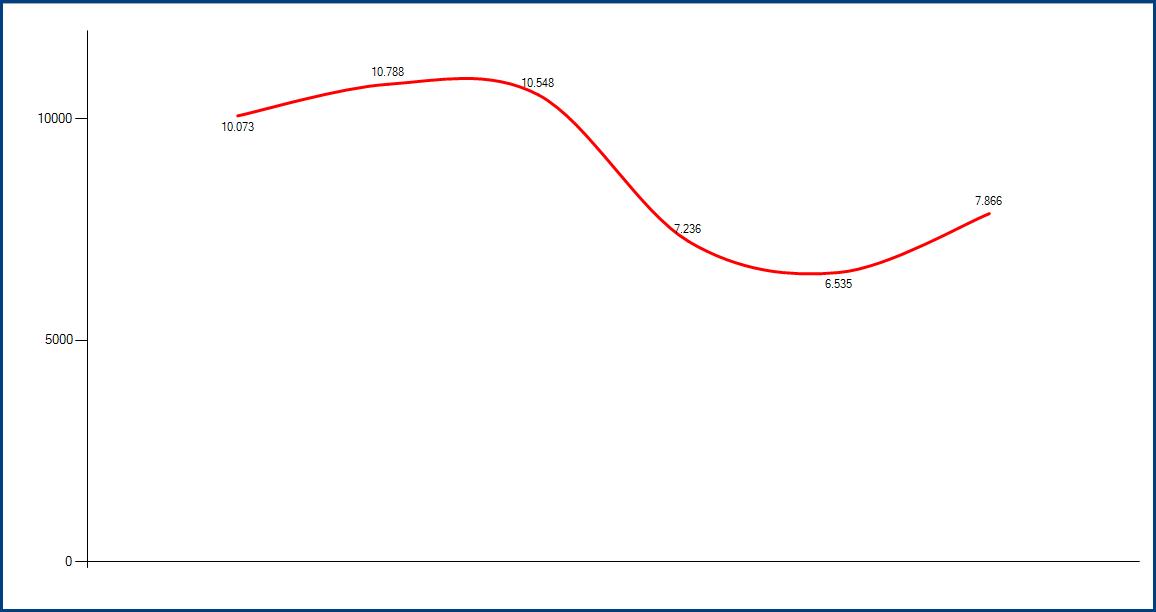
Why this code don't display the names of months in the Axis X?
Can you help me?
Thanks in advance.
Chart1.ChartAreas["ChartArea1"].AxisX.MajorGrid.Enabled = false;
Chart1.ChartAreas["ChartArea1"].AxisY.MajorGrid.Enabled = false;
Chart1.ChartAreas["ChartArea1"].AxisX.IsMarginVisible = true;
Chart1.Series.Add("Series1");
Chart1.Series["Series1"].LabelFormat = "#,##";
Chart1.Series["Series1"].XValueMember = "month";
Chart1.Series["Series1"].YValueMembers = "number";
Chart1.Series["Series1"].ChartType = SeriesChartType.Spline;
Chart1.Series["Series1"].IsValueShownAsLabel = true;
Chart1.Series["Series1"].IsValueShownAsLabel = true;
Chart1.Series["Series1"]["ShowMarkerLines"] = "True";
Chart1.Series["Series1"]["ShowMarkerLines"] = "True";
Chart1.Series["Series1"].BorderWidth = 3;
Chart1.Series["Series1"].Color = Color.Red;
Chart1.DataSource = objCmd.ExecuteReader();
Chart1.DataBind();
Chart1.SaveImage(PNG, ChartImageFormat.Png);
<asp:Chart ID="Chart1" runat="server" Width="1200" Height="600">
<ChartAreas>
<asp:ChartArea Name="ChartArea1">
<AxisX Interval="5000">
</AxisX>
<AxisY Interval="5000">
</AxisY>
</asp:ChartArea>
</ChartAreas>
</asp:Chart>