im trying to make a graph using javascript but failing is there anyone who is knows javascript that can help thats the graph im trying to make below

but mine looks different to that here is how it looks
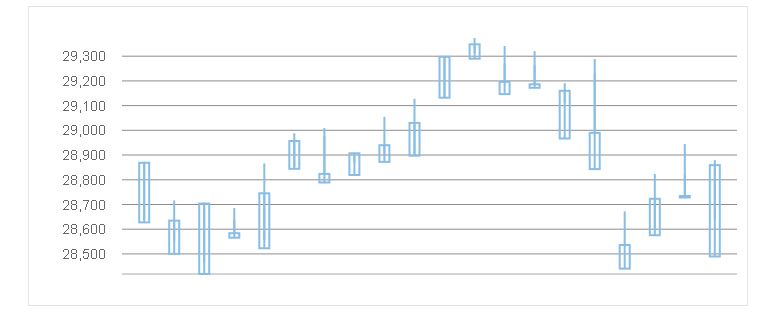
if anyone knows how to do it heres the link where my code is using google charts https://jsfiddle.net/movenm123/s8kt0eh7/123/#&togetherjs=8Q1nLR4DTJ