Introduction:
In this article we will learn how to create a chart for our ASP.NET application.
Background:
Here we will see how to draw a chart for our data in ASP.Net. We are using a third party control to draw our chart. This is a .dll file I found somewhere using Google search. It's not my .dll. This .dll file provides various types of charts such as LineChart, PieChart, CircleChart etc...
To prepare for a chart using this .dll file follow the steps given below.
Step 1:
Start a new web-site; give the name as ChartInAsp.Net. It will give you one Default.aspx and .cs file.
Step 2:
Download source code and copy the Webchart.dll file from the bin directory to some location. Now add a reference to this WebChart.dll file.
Step 3:
Now Register this dll in your Page directory such as shown bellow. And get the Chart control from this dll.
<%@ Register TagPrefix="Web" Namespace="WebChart" Assembly="WebChart" %>
<Web:ChartControl ID="ChartControl1" runat="Server" Height="366px"
Width="500px" />
Step 4:
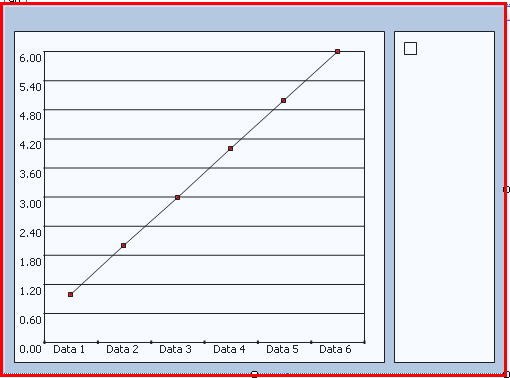
Now move to Design view and see that the Chart control is created as shown below. Whenever we are creating this control the default chart is LineChart; you can change it to another type by setting it's type property in property window or in the .cs file. We will see how to change it again in the .cs file.
Step 5:
Now move to .cs file and Import the WebChart as shown below.
using WebChart;
Step 6:
Now get your Data from database or prepare only Dataset or DataTable.
// Preparing Data Source For Chart Control
DataTable dt = new DataTable("Chart");
DataColumn dc = new DataColumn("Year", typeof(int));
DataColumn dc1 = new DataColumn("Aveg", typeof(double));
dt.Columns.Add(dc);
dt.Columns.Add(dc1);
DataRow dr = dt.NewRow();
dr[0] = 1995;
dr[1] = 10.5;
dt.Rows.Add(dr);
DataRow dr1 = dt.NewRow();
dr1[0] = 2000;
dr1[1] = 11.5;
dt.Rows.Add(dr1);
Step 7:
Now bind this data to the chart control. Here you can choose either LineChart, CircleChart or PieChart etc… Here we will bind the data to our LineChart and color this chart as follows.
//Chart type you can change chart type here ex. pie chart,circle chart
LineChart chart = new LineChart();//Class instance for LineChart
chart.Fill.Color = Color.FromArgb(50, Color.SteelBlue);
chart.Line.Color = Color.SteelBlue;
chart.Line.Width = 2;
chart.Legend = "X Axis: Year.\nY Axis: Average";
//looping through datatable and adding to chart control
foreach (DataRow dr2 in dt.Rows)
{
chart.Data.Add(new ChartPoint(dr2["Year"].ToString(), (float)System.Convert.ToSingle(dr2["Aveg"])));
}
ConfigureColors();
ChartControl1.Charts.Add(chart);
ChartControl1.RedrawChart();
Step 8:
The ConfigureColors Method to color our chart.
private void ConfigureColors()
{
ChartControl1.Background.Color = Color.FromArgb(75, Color.SteelBlue);
ChartControl1.Background.Type = InteriorType.LinearGradient;
ChartControl1.Background.ForeColor = Color.SteelBlue;
ChartControl1.Background.EndPoint = new Point(500, 350);
ChartControl1.Legend.Position = LegendPosition.Bottom;
ChartControl1.Legend.Width = 40;
ChartControl1.YAxisFont.ForeColor = Color.SteelBlue;
ChartControl1.XAxisFont.ForeColor = Color.SteelBlue;
ChartControl1.ChartTitle.Text = "GRAPH EXAMPLE IN ASP.NET";
ChartControl1.ChartTitle.ForeColor = Color.White;
ChartControl1.Border.Color = Color.SteelBlue;
ChartControl1.BorderStyle = BorderStyle.Ridge;
}
Step 9:
Now run your application; it will show a nice chart Control to you. This dll will create a WebCharts folder in your application Directory for storing chart Images.
Conclusion:
In this way you can prepare various types of charts for you ASP.Net application.