Hi iam trying to append the dynamic data to highchart in series.And iam using column chart my code in jquery is some thing like this
- <div id="container" style="min-width: 310px; height: 400px; margin: 0 auto"></div>
-
- function GetEmpDetails() {
- $.ajax({
- type: "POST",
- url: "../Home/GetData",
- data: JSON.stringify({ abc: abc }),
- contentType: "application/json; charset=utf-8",
- dataType: "json",
- success: function (result) {
- console.log(result);
- for (x in result) {
- var dataobject = new Object();
- dataobject.salary = result[x].SALARY;
- dataobject.name = result[x].NAME;
- obj.push(dataobject);
- }
- visitorData(obj);
- }
-
- });
- }
-
- function visitorData(obj) {
-
-
- Highcharts.chart('container', {
- chart: {
- type: 'column'
- },
- title: {
- text: 'Salary per Month'
- },
- subtitle: {
- text: ''
- },
- xAxis: {
- type: 'category',
- categories: obj.NAME
- },
- yAxis: {
- title: {
- text: 'Total Work Done'
- }
-
- },
- legend: {
- enabled: false
- },
- plotOptions: {
- series: {
- borderWidth: 0,
- dataLabels: {
- enabled: true,
- format: '{point.y:.1f}%'
- }
- }
- },
-
- tooltip: {
- headerFormat: '<span style="font-size:11px">{series.name}</span><br>',
- pointFormat: '<span style="color:{point.color}">{point.name}</span>: <b>{point.y:.2f}%</b> of total<br/>'
- },
-
-
- "series": [
- {
- "name": "Browsers",
- "colorByPoint": true,
- "data": [
- {
- "name": obj.names,
- "y": obj.salaries,
- }
- ]
-
- }
- ]
- })
- }
if you see in above example in ajax call iam getting the dynamic data in RESULT in sucess message.Finally iam filtering the data and getting the 2 columns for X axis and Y axis data is getting perfectly but iam sturct at how to append in series in data.Iam getting the data in console in
visitorData() like this
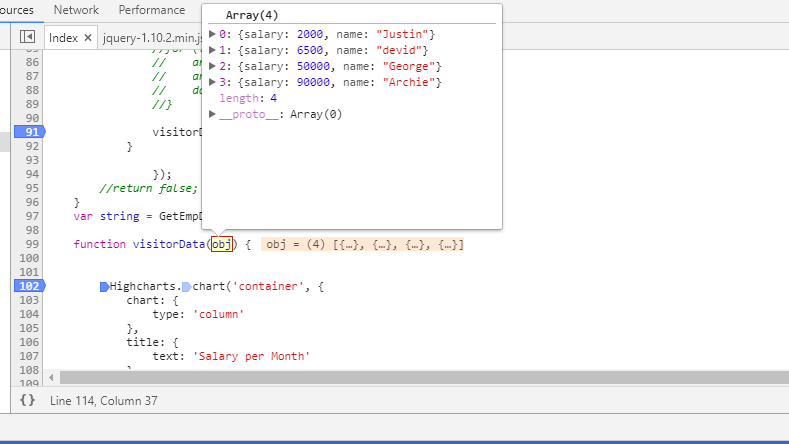
Please help me...Thank you in advance