Python Libraries for Machine Learning: Scikit-Learn
Python Scikit-Learn
In the previous chapter, we studied Python Pandas, its functions, and its python implementations.
In this chapter, we will start with the next very useful and important Python Machine Learning library "Python Scikit-Learn".
What is Scikit-Learn?
Scikit-learn (formerly scikits.learn) is a free software machine learning library for the Python programming language.
It features various classification, regression and clustering algorithms including support vector machines, random forests, gradient boosting, k-means, and DBSCAN, and is designed to interoperate with the Python numerical and scientific libraries NumPy and SciPy.
The scikit-learn project started as scikits.learn a Google Summer of Code project by David Cournapeau. Its name stems from the notion that it is a "SciK features various classification, regression and clustering algorithms including support vector machines, random forests, gradient boosting, k-means and DBSCAN, and is designed to interoperate with the Python numerical and scientific libraries NumPy and SciPy. it" (SciPy Toolkit), a separately-developed and distributed third-party extension to SciPy.
It was first released in June 2012. The official website is www.scikit-learn.org.
Are Scikit-Learn and Sklearn same?
Yes, both are the same, with the difference that "scikit-learn" is the official name of the package and is mostly used only for installing the package, whereas "sklearn" is the abbreviated name which is used when we have to use it for python programming.
Features of Scikit-Learn
- Clustering
for grouping unlabeled data such as KMeans.
- Cross-Validation
for estimating the performance of supervised models on unseen data.
- Datasets
for test datasets and for generating datasets with specific properties for investigating model behavior.
- Dimensionality Reduction
for reducing the number of attributes in data for summarization, visualization, and feature selection such as Principal component analysis.
- Ensemble methods
for combining the predictions of multiple supervised models.
- Feature extraction
for defining attributes in image and text data.
- Feature selection
for identifying meaningful attributes from which to create supervised models.
- Parameter Tuning
for getting the most out of supervised models.
- Manifold Learning
For summarizing and depicting complex multi-dimensional data.
- Supervised Models
a vast array not limited to generalized linear models, discriminate analysis, naive Bayes, lazy methods, neural networks, support vector machines, and decision trees.
Installing Scikit-Learn in Python
1. Ubuntu/Linux
- sudo apt update -y
- sudo apt upgrade -y
- sudo apt install python3-tk python3-pip -y
- sudo pip install scikit-learn -y
2. Anaconda Prompt
- conda install scikit-learn
Classification
Classification is the process of predicting the class of given data points. Classes are sometimes called as targets/ labels or categories. Classification predictive modeling is the task of approximating a mapping function (f) from input variables (X) to discrete output variables (y).
For example, spam detection in email service providers can be identified as a classification problem. This is s binary classification since there are only 2 classes as spam and not spam.
A classifier utilizes some training data to understand how given input variables relate to the class. In this case, known spam and non-spam emails have to be used as the training data. When the classifier is trained accurately, it can be used to detect an unknown email.
Classification belongs to the category of supervised learning where the targets also provided with the input data. There are many applications in classification in many domains such as in credit approval, medical diagnosis, target marketing, etc.
- from sklearn import datasets
- from sklearn.linear_model import LinearRegression
- digits = datasets.load_digits() #loading the MNIST Digits Database
- clf=LinearRegression() #creating LinearRegression Classifier
Python Scikit-Learn Functions
1. Loading Dataset
Scikit-learn comes with a few standard datasets, for instance, the iris and digits datasets for classification and the Boston house prices dataset for regression.
- from sklearn import datasets
- iris = datasets.load_iris()
- digits = datasets.load_digits()
The above code will load iris dataset into "iris" and MNIST Digits dataset into "digits"
- ndarray.data
we use data attribute to show the data that was loaded
- print(digits.data)
The above will result in the following: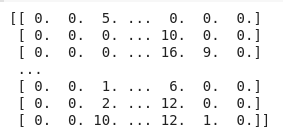 Similarly, we can print
iris.data - ndarray.target
we use the target attribute to show the labels of the dataset that we loadedThe above will result : [0 1 2 ... 8 9 8]. Similarly, we can print
- print(digits.target)
iris.target
2. Breaking data into Training and Test Set
A dataset can be divided into 3 parts:
1. Test Set
It is the part of the dataset which is used for Black box testing, i.e. here the motive is to test the model on data that the model has never seen before. Here we use metrics like the Confusion Matrix, accuracy score, and F1 score.
2. Training Set
It is the part of the dataset which is used to train the model and make the hypothesizes more accurate
3. Validation set
In machine learning, when we generate a model, we need to validate the model before sending it for the final testing. So to validate the working of the model we use the validation set
For Example:
Let us take the MNIST cloth dataset
Here we would like to generate a model that can predict the type and genre of the cloth.
So to do so, we would divide the whole fo the dataset into a ratio of 7:3 where 70% of the data is the training+Validation Data and 30% is the Test data
In Python to segregate the training and test data, we use the sklear.model_selection.train_test_split()
- from sklearn import datasets
- from sklearn.model_selection import train_test_split
- digits = datasets.load_digits() #loading the MNIST Digits Database
- X,y = digits.data, digits.target
- X_train, X_test, y_train, y_test = train_test_split( X, y, test_size=0.3, random_state=0)
The above code demonstrates how to divide the dataset in the 7:3 ratio
3. Learning and Predicting
Learning
Learning is the process of acquiring new or modifying existing, knowledge, behaviors, skills, values, or preferences. The ability to learn is possessed by humans, animals, and some machines; there is also evidence for some kind of learning in certain plants.
In the case of Machine Learning, learning is a process that improves the knowledge of an AI program by making observations about its environment.
Prediction
A prediction, or forecast, is a statement about a future event. A prediction is often, but not always, based upon experience or knowledge. There is no universal agreement about the exact difference between the two terms; different authors and disciplines ascribe different connotations.
“Prediction” refers to the output of an algorithm after it has been trained on a historical dataset and applied to new data when you’re trying to forecast the likelihood of a particular outcome, such as whether or not a customer will churn in 30 days. The algorithm will generate probable values for an unknown variable for each record in the new data, allowing the model builder to identify what that value will most likely be.
1. classifier.fit(labels,targets)
The
fit the method is provided on every estimator. It usually takes some samples x, targets y if the model is supervised, and potentially other sample properties such as sample_weight. It should:- clear any prior attributes stored on the estimator, unless warm_start is used;
- validate and interpret any parameters, ideally raising an error if invalid
- validate the input data;
- estimate and store model attributes from the estimated parameters and provided data, and
- return the now fitted estimator to facilitate method chaining.
- from sklearn import datasets
- from sklearn.linear_model import LinearRegression
- digits = datasets.load_digits() #loading the MNIST Digits Database
- clf=LinearRegression() #creating LinearRegression Classifier
- X,y = digits.data[:-10], digits.target[:-10] #selecting the first 10 data and targets
- clf.fit(X,y) #we fitted the given data and targets to form a model
Predicts each sample, usually only taking X as input (but see under regressor output conventions below). In a classifier or regressor, this prediction is in the same target space used in fitting (e.g. one of {‘red’, ‘amber’, ‘green’} if the
y in fitting consisted of these strings). Despite this, even when y passed to fit is a list or other array-like, the output of predict should always be an array or sparse matrix. In a clustered or outlier detector the prediction is an integer.If the estimator was not already fitted, calling this method should raise a
exceptions.NotFittedError.- from sklearn import datasets
- from sklearn.linear_model import LinearRegression
- digits = datasets.load_digits() #loading the MNIST Digits Database
- clf=LinearRegression() #creating LinearRegression Classifier
- X,y = digits.data[:-10], digits.target[:-10] #selecting the first 10 data and targets
- clf.fit(X,y) #we fitted the given data and targets to form a model
- clf.predict(X[0].reshape(1,-1)) #we are predicting the output based on the trained model
4. Performance Analysis
1. classifier.confusion_matrix()
A confusion matrix is a table that is often used to describe the performance of a classification model (or “classifier”) on a set of test data for which the true values are known. It allows the visualization of the performance of an algorithm.
- It allows easy identification of confusion between classes e.g. one class is commonly mislabeled as the other. Most performance measures are computed from the confusion matrix.
- The number of correct and incorrect predictions are summarized with count values and broken down by each class. This is the key to the confusion matrix.
- The confusion matrix shows how your classification model is confused when it makes predictions.
- It gives us insight not only into the errors being made by a classifier but more importantly the types of errors that are being made.
- Confusion Matrix is often used for calculations of accuracy score
| Positive | Negative | |
| True | TP | TN |
| False | FP | FN |
- # Python script for confusion matrix creation.
- from sklearn.metrics import confusion_matrix
- actual = [1, 1, 0, 1, 0, 0, 1, 0, 0, 0]
- predicted = [1, 0, 0, 1, 0, 0, 1, 1, 1, 0]
- results = confusion_matrix(actual, predicted)
- print ('Confusion Matrix :')
- print(results)
2. classifier.accuracy_score()
A method on an estimator, usually a predictor, which evaluates its predictions on a given dataset, and returns a single numerical score. A greater return value should indicate better predictions; accuracy is used for classifiers and R^2 for regressors by default.
If the estimator was not already fitted, calling this method should raise a
exceptions.NotFittedError.Some estimators implement a custom, estimator-specific score function, often the likelihood of the data under the model.
Accuracy = (TP+TN)/ (TP+TN+FN+FP)
where, TP- True Positive
TN- True Negative
FN- False Negative
FP- False Positive
- from sklearn.metrics import accuracy_score
- y_pred = [0, 2, 1, 3]
- y_true = [0, 1, 2, 3]
- accuracy_score(y_true, y_pred)
| Sno. | Function Name | Description |
| 1 | sklearn.base | Base Class for all the Estimators |
| 2 | sklear.calibration | Calibration of Predicted Probabilities |
| 3 | sklear.cluster | It provides various unsupervised learning algorithms |
| 4 | sklearn.cluster.k_means | Provides all the functionalities of the K-Means clustering algorithm |
| 5 | sklear.cluster.bicluster | It provides the spectral biclustering algorithms |
| 6 | sklearn.compose | Meta-estimators for building composite models with transformers |
| 7 | sklearn.covariance | This module includes methods and algorithms to robustify estimate the covariance of features given a set of points. The precision matrix defined as the inverse of the covariance is also estimated |
| 8 | sklearn.cros_decomposition | It provides methods and algorithms to support cross decomposition |
| 9 | sklearn.datasets | This module includes utilities to load datasets, including methods to load and fetch popular reference datasets. It also provides artificial data generators |
| 10 | sklearn.decomposition | This module includes matrix decomposition algorithms, including among others PCA, NMF, or ICA. |
| 11 | sklearn.discriminant_analysis | It provides Linear Discriminant Analysis and Quadratic Discriminant Analysis |
| 12 | sklearn.dummy | It provides Dummy Estimatators which are helpful to get a baseline value of those metrics for random predictions |
| 13 | sklearn.ensemble | This module includes ensemble-based methods for classification, regression and anomaly detection |
| 14 | sklearn.exceptions | This module contains all custom warnings and error classes used across scikit-learn |
| 15 | sklearn.experimental | This module provides importable modules that enable the use of experimental features or estimators |
| 16 | sklearn.feature_extraction | This module deals with features extraction from raw data. It can currently extract features from text and images |
| 17 | sklearn.feature_selection | This module implements feature selection algorithms. It currently provides univariate filter selection methods and the recursive feature elimination algorithm |
| 18 | sklearn.gaussian_process | This module implements Gaussian Process-based regression and classification |
| 19 | sklearn.isotonic | This module provides us with capabilities to implement isotonic regression |
| 20 | sklearn.impute | It provides transformers for missing value imputation |
| 21 | sklearn.kernel_approximation | This module implements several approximate kernel feature maps based on Fourier Transforms |
| 22 | sklearn.kernel_ridge | It provides capabilities to help us implement kernel ridge regression |
| 23 | sklearn.linear_model | It module implements generalized linear models. It includes Ridge regression, Bayesian Regression, Lasso and Elastic Net estimators computed with Least Angle Regression and coordinate descent. It also implements Stochastic Gradient Descent related algorithms. |
| 24 | sklearn.linear_model.LinearRegression | It provides functionalities to implement Linear Regression |
| 25 | sklearn.linear_model.LogisticRegression | It provides functionalities to implement Logistic Regression |
| 26 | sklearn.mainifold | This module implements data embedding techniques |
| 27 | sklearn.metrics | It includes score functions, performance metrics and pairwise metrics and distance computations |
| 28 | sklearn.metrics.accuracy_score | It gives the accuracy classification score |
| 29 | sklearn.metrics.confusion_matrix | It gives the confusion matrix |
| 30 | sklearn.metrics.f1_Score | It gives the F1 score or balanced F-score or F-measure |
| 31 | sklearn.metrics.classification_report | It builds a text report showing the main classification metrics |
| 32 | sklearn.metrics.precision_score | It gives the precision of the classification |
| 33 | sklearn.metrics.mean_absolute_error | It gives the mean absolute error regression loss |
| 34 | sklearn.metrics.mean_squared_error | It gives the mean squared error regression loss |
| 35 | sklearn.mixture | This module implements mixture modelling algorithms |
| 36 | sklearn.model_selection | This module contains model selections functions |
| 37 | sklearn.multiclass | This module provides functionalities for implementation of multiclass and multilabel classification |
| 38 | sklearn.multioutput | This module implements multioutput regression and classification. The estimators provided in this module are meta-estimators: they require a base estimator to be provided in their constructor. The meta-estimator extends single output estimators to multi-output estimators. |
| 39 | sklearn.naive_bayes | This module implements Naive Bayes algorithms. These are supervised learning methods based on applying Bayes’ theorem with strong (naive) feature independence assumptions. |
| 40 | sklearn.neighbours | This module implements the k-nearest neighbors' algorithm. |
| 41 | sklearn.neaural_network | This module includes models based on neural networks |
| 42 | sklearn.pipeline | This module implements utilities to build a composite estimator, as a chain of transforms and estimators |
| 43 | sklearn.inspection | This module includes tools for model inspection |
| 44 | sklearn.preprocessing | This module includes scaling, centering, normalization, binarization and imputation methods |
| 45 | sklearn.random_projection | It provides random_projection. Random Projections are a simple and computationally efficient way to reduce the dimensionality of the data by trading a controlled amount of accuracy (as additional variance) for faster processing times and smaller model sizes. |
| 46 | sklearn.semi_supervised | This module implements semi-supervised learning algorithms. These algorithms utilized small amounts of labeled data and large amounts of unlabeled data for classification tasks. This module includes Label Propagation. |
| 47 | sklearn.svm | This module includes Support Vector Machine algorithms |
| 48 | sklearn.tree | This module includes decision tree-based models for classification and regression. |
| 49 | sklearn.utils | It includes various utilities |
Conclusion
In this chapter, we studied Python SciKit-Learn. In the next chapter, we will learn about Python MatPlotLib.
Python MatPlotLib is an excellent library that provides an object-oriented API for embedding plots into applications using general-purpose GUI toolkits.
Author

Rohit Gupta
13
61k
3.2m