Charts
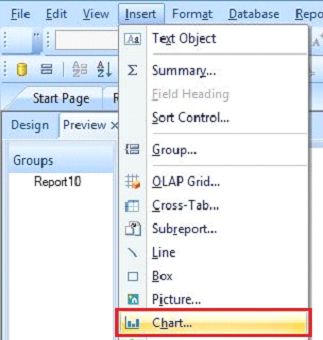
The chart is used in Crystal Report to create our report more attractive. Using the chart, we can easily understand the data, which we used in our report and find many records easily within the multiple records. Thus, create the chart in the structure first, insert the data and go to Insert → Chart.
When we go to Chart Option, we see a small window 'Chart Expert'. This Window provides us, many facilities to create the chart like,
When we go to Chart Option, we see a small window 'Chart Expert'. This Window provides us, many facilities to create the chart like,
- Type
- Data
- Axis
- Option
- Colour Highlight
- Text
We can use any chart types in Crystal Reports according to our reports. It also gives the option to set the data in vertical, horizontal and depth effect.
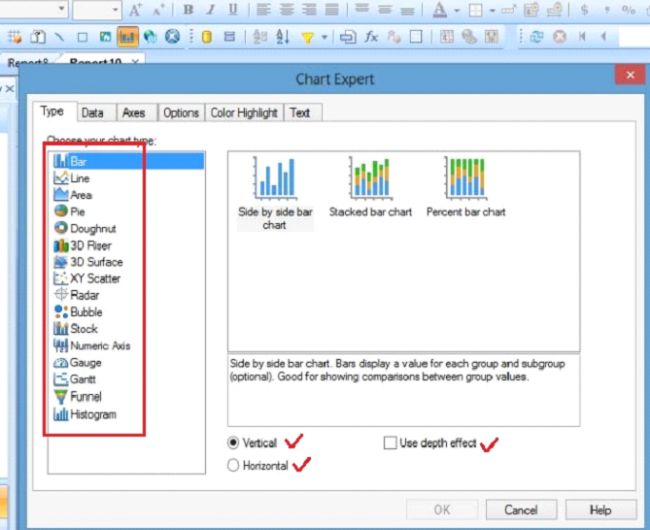
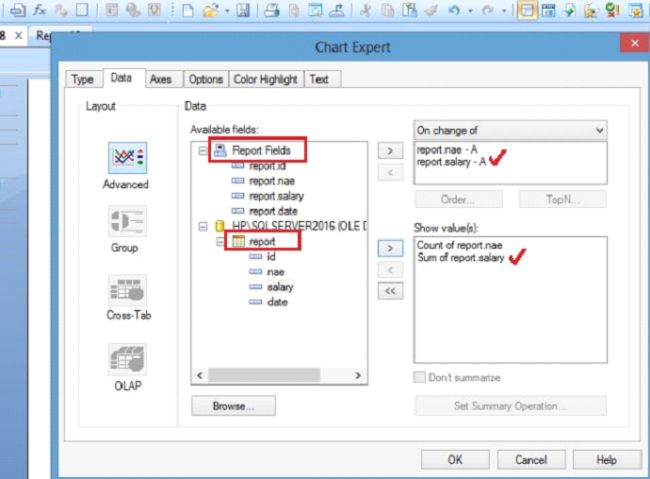
Chart Data
Chart Data helps to insert the data in the report. After selecting the data, click OK. It gives us two options - Report Field and Chart Report.
Report Field
Report Field is used to pick up the fields from the database in Crystal Reports chart.
Report
Report is used to pick the data from the database in Crystal Reports chart.
Axis
Axis is used to show the values and number of division of the data in the report. Here, data tab allows us to insert the data in the chart.
Option
Option is used to show the chart colour, data point, layout, footnote, legend etc. in the report.
Colour Highlight
In the Colour Highlight, we can set the colour of the chart.
Text
Text allows us to set the font setting in the chart.
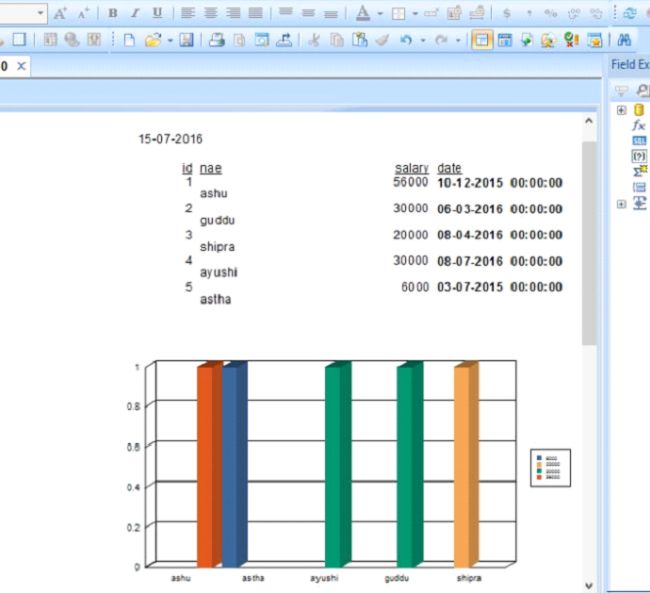
Now, after completing all the process, we see our chart on the report, as shown below,
Formatting Charts
Format Structure is used to do the formatting of the chart. We can also change the chart type from the dropdown list. When we right click on the chart in the report, it gives many options like,
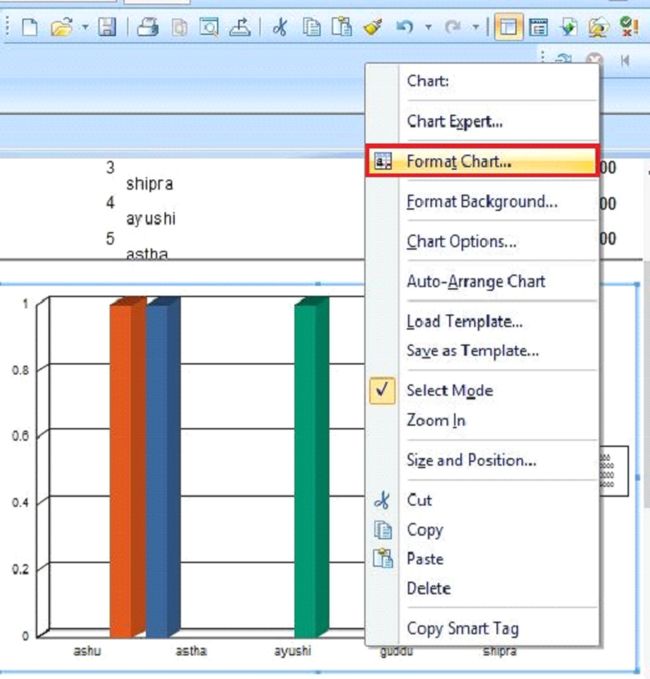
Format Editor - Format Editor have three parts,
Text
Text allows us to set the font setting in the chart.
Now, after completing all the process, we see our chart on the report, as shown below,
Formatting Charts
Format Structure is used to do the formatting of the chart. We can also change the chart type from the dropdown list. When we right click on the chart in the report, it gives many options like,
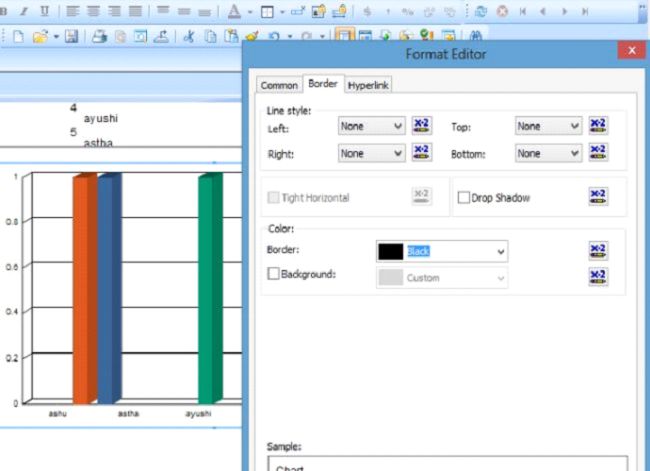
Format Editor - Format Editor have three parts,
- Common
- Border
- Hyperlink
Summary
Thus, we learnt, how to make our report more effective with the chart in Crystal Report.