GUI Navigation
We use the Crystal Report for quickly and easily creating the reports. GUI Navigation is a way to create the reports more effectively. Now, we explain some features of Crystal Report.
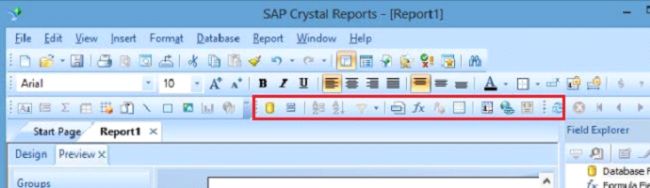
In Crystal Report platform, we find many features, which helps in the report making. Here, Insert, Formatting, Database, Report Design Canvas are the most basic features, which we use to create our report.
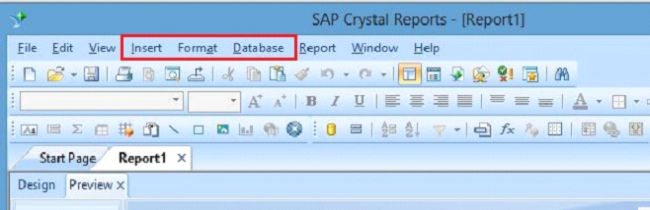
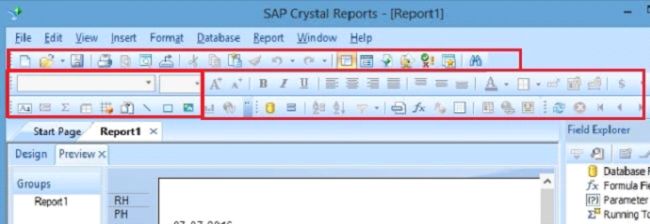
Crystal Report features are shown below like new report, open, save, print, print view, HTML print view, cut, paste, left, right, center, top, bottom, below, justify, font color, border, export and undo.
Insert
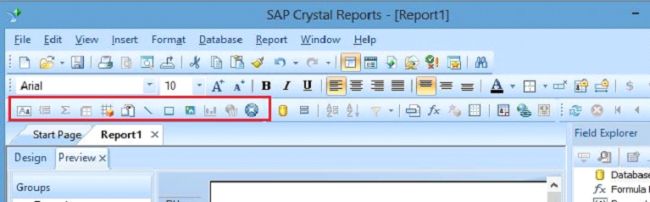
We use this tab to insert the features into our report. This tab makes our report more effective and useful. Insert includes the - insert group, insert object, insert group, insert tab, OLAP grid, insert sub report, insert line, insert box, insert picture, insert chart, insert map, insert Flash object.
Format
In Crystal Report platform, we find many features, which helps in the report making. Here, Insert, Formatting, Database, Report Design Canvas are the most basic features, which we use to create our report.
Crystal Report features are shown below like new report, open, save, print, print view, HTML print view, cut, paste, left, right, center, top, bottom, below, justify, font color, border, export and undo.
Insert
We use this tab to insert the features into our report. This tab makes our report more effective and useful. Insert includes the - insert group, insert object, insert group, insert tab, OLAP grid, insert sub report, insert line, insert box, insert picture, insert chart, insert map, insert Flash object.
Format
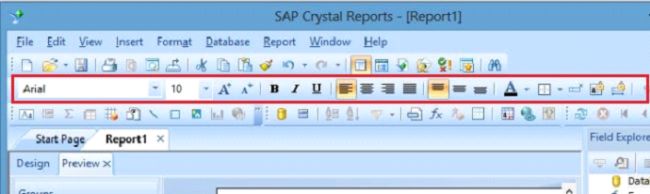
The Format tab is used to create the formatting in the selected field. This tab includes the font size, background colour, font colour, alignment of the text, left, right, top, bottom, centre etc.
Database
This tab is used to create the work with the data-editing queries. We also use some features in this tab like creating groups, sort groups, filters to limit the data etc.
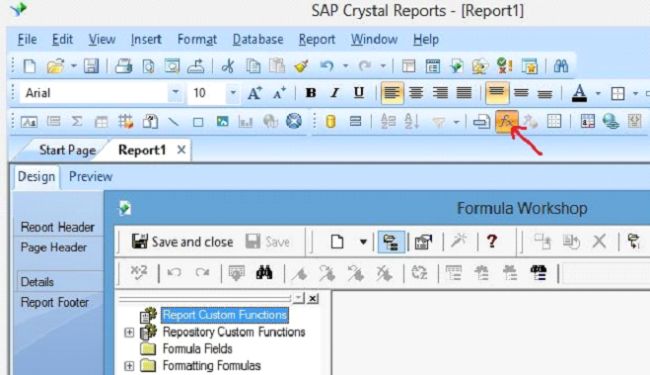
Formula
This tab is used to create the calculations in the report. We use Formula button by typing or by clicking on the objects, functions and operators in the Data Explorer.
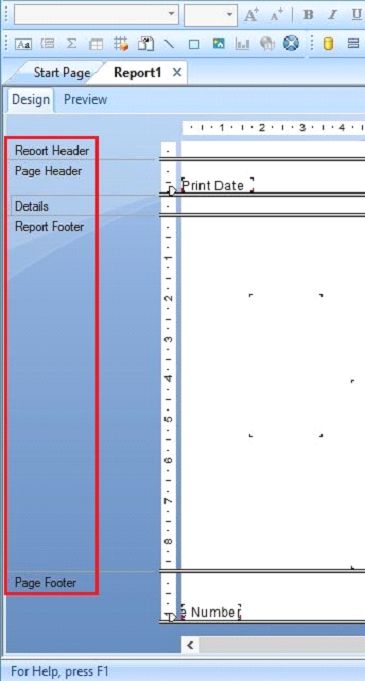
Report Design Canvas
Report Design Canvas is the working area in Crystal Report. It is divided into two main parts,
- Structure Tab
- Page Tab
- Report Heade
- Page Header
- Details
- Report Footer
- Page Footer
Summary
Thus, we learnt, that with the GUI Navigation, we make our report more attractive in Crystal Report.